We work in partnership with: Quantis & Southpole
By leveraging a single data source for reporting, monitoring, and planning deforestation and carbon measurement ensures consistent and coherent information across the entire business and industry.
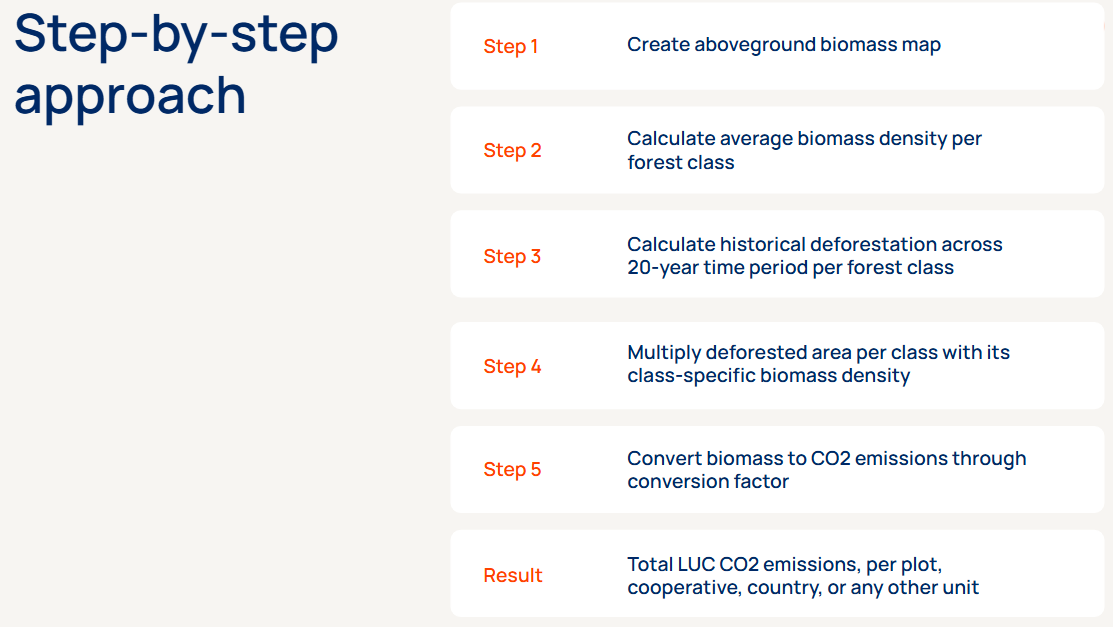
How do we measure land use change emissions and removals in your supply chain?
Carbon in aboveground biomass (AGB) can be estimated & monitored with satellite image-fed ML systems over large areas and timescales
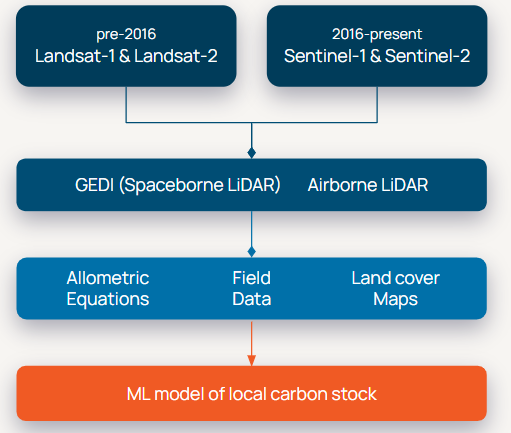
Emissions
We combine Landsat, Sentinel-1, Sentinel-2 and spaceborne LiDAR data to produce reliable carbon stock assessments on and around plots and landscapes. We enhance our models with Very High Resolution commercial imaging (airborne LiDAR). We apply allometric equations and ML mapping, to create consistent, data-driven models of the carbon levels in your supply chain across space and time. ML uses a Random Forest regression model - a human-supervised, ensemble-based self-learning algorithm.
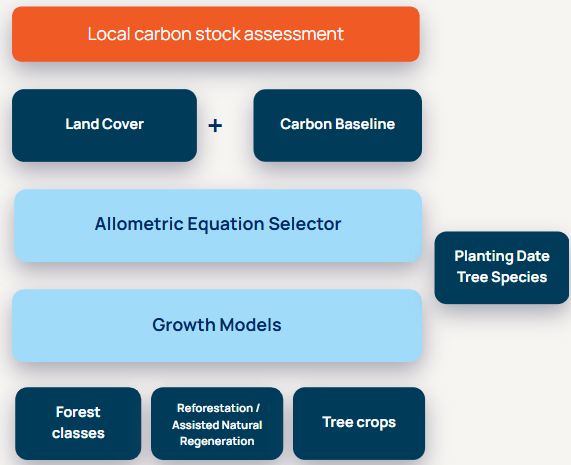
Removals
Following the same logic as our methodology for emissions to set the baseline for carbon levels in your supply chain. This combined with the information on the remaining forests, conservation set-asides, and planned reforestation / assisted natural regeneration areas on concessions enables a more specific allometric equation to be selected. We then apply the appropriate growth model(s) for the plots where forests are to be conserved or restored and we monitor the ‘asset’ to ensure the trees have not been cleared. For each year that the asset is undisturbed we continue to apply the growth model and on one to five year increments we measure the new levels of biomass across all plots.
Our methodology aligns with SBTi FLAG and GHG protocol
The GHG protocol supports several tiers of granularity for data sources. See table below for examples of the different carbon stock components (Quantis, 2023).
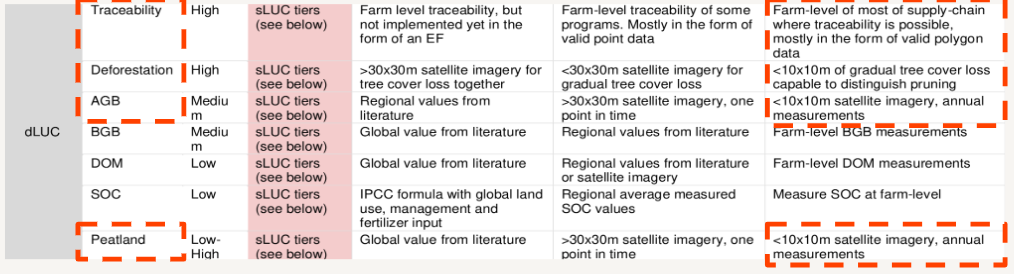
Satelligence delivers the most granular tier data (Tier 3) for the Deforestation, AGB components, which are the major and most dynamic components in tropical eco-regions. We deliver peatland data as part of our analysis and continue to improve this layer as co-founders of the Global Peatlands Initiative (GPI) in 2016.
We pull from open data sources to complement our analysis with information on BGB, DOM, and SOC.
But what really sets us apart?
To monitor changes in carbon stock and emissions, every service provider will use the same input data (GEDI, LS, S1/2), and the ~same approach (Random Forest Machine Learning). Where they differ:
-
Quality of the preprocessing of the input data, and
-
Selection of allometric equations based on vegetation class
Satelligence has the world's best satellite processing engine, as well as the world's best Forest Baseline. No other service provider can provide globally & temporally consistent and coherent biomass estimates on an operational basis.