
Deforestation risk inside the plot
Non-Deforestation Free
A plot is considered Non Deforestation Free (NDF) when there is deforestation inside plots. In this category, plots are sorted by descending deforestation inside plots since the cutoff date. Find NDF plots with low amounts of deforestation by inverting the list.
NDF plots can also be linked to ‘cases’ that you can view and investigate by clicking on a single plot. On the map it is possible to view all deforestation inside the plot.
💡 We have a minimum mapping unit of 0.1ha which is sufficient to capture forest degradation as well as deforestation under EUDR. This threshold is determined by the minimum mapping unit of the system which is set to 0.1 ha, because the minimum surface area that is reliably classified as a deforestation detection is 0.1 ha. If one pixel that is part of a 0.1 ha (or larger) deforestation detection is within a plot then this means that deforestation is identified within a plot.
Deforestation Free
A plot is considered Deforestation Free (DF) when there is no deforestation inside plots. But keep in mind that other risk factors can be present within the landscape of the plot.
Deforestation risk around the plot
A plot is considered Deforestation Free (DF) when there is no deforestation inside the plot. But there are other risk factors that can be present within the landscape of the plot. At Satelligence, we also monitor the risk in a 500m buffer* around the plot. This is for a number of reasons:
-
Firstly, it captures the risk of farmers expanding their cultivation areas and Non Deforestation Free commodities leaking into your supply chain.
-
Secondly, it offers a proactive approach to monitor land use change that is happening in the vicinity of your supply chain that could be converted to agricultural use in the next few years.
-
Thirdly, it enables you to further prioritize your risk mitigation efforts with your suppliers.
-
Lastly, there is the chance that the plot boundaries that are submitted to you by your suppliers may not be completely accurate. By applying a 500m buffer area around the plot, we also account for the possible risk that the plot boundary was mapped much smaller than the actual farm boundary.
If your main concern is compliance today, then monitoring for the presence of deforestation inside the plot is sufficient.
If you want to mitigate future deforestation risk before it affects your supply chain, then it is important to assess risk within the broader landscape of the plot as well.
*Please note that the EUDR does not specifically mention the requirement to assess deforestation risk within a 500m buffer area around the plot. The EUDR only states that operators must perform a comprehensive risk assessment to ensure there is no or only negligible risk of deforestation associated with the products sourced, and as part of this process, you must assess the presence of forest, presence of indigenous territories and prevalence of deforestation. While not explicitly mentioned in the regulation, Satelligence considers that these requirements collectively imply the need for evaluating various risk factors in the surrounding areas of your plots and overall sourcing landscape. We do this by applying a 500m buffer around the plot, given that the likelihood of your supply chain being linked to deforestation if it happens in the direct vicinity of one of your suppliers' plots is quite high.
Landscape Risk factors
Satelligence screens for the presence of four landscape risk factors:
-
Presence of forest: whether the plot contains forest or there is forest within 500m of the plot boundary
-
Presence of protected areas: whether the plot is inside a protected area or there are protected areas located within 500m of the plot boundary
-
Presence of indigenous territories: whether the plot is located inside community land or in an area designated as indigenous territory or those areas are within 500m of the plot boundary
-
Prevalence of deforestation: whether there is detected deforestation since EUDR cutoff date within 500m of the plot boundary
Where any of these factors are identified, they provide additional understanding of the landscape risk, indicating the need for continuous monitoring and, where necessary, risk mitigation as part of EUDR due diligence.
If any or all risk factors are present, then the plot is labeled as non-negligible risk. If no factors are present then the plot is considered to have negligible risk. You can use these labels as additional filters to prioritize your engagement.
Filter on Supplier
The default view of the module shows the total number of plots for all the suppliers in your supply chain. To know more about the plot categorisation per supplier, click on a supplier from the left column to filter out the numbers.
Plots are linked to suppliers based on the plot upload on the Data Manager page > Supply Chain. By selecting a supplier, your plot list is filtered for the plots that were uploaded by or provided for that supplier via the Data Manager page > Supply Chain page or a bulk upload via our support team.
Sort Suppliers by Deforestation %
You can also sort your Supplier list based on the percentage of deforestation free plots (linked to each Supplier). This feature allows you to sort your Suppliers based on the following below. This helps you further narrow the Supplier list down to those that have higher DF% within their supply chains, allowing you to prioritize your resources for further engagement and eventual mitigation.
- Supplier names
- Supplier volumes
- Deforestation free percentage of linked plots
Filter Suppliers on Deforestation amount
This new, deforestation-area filter allows you to filter your supplier list on the risk assessment page for specific amounts of deforestation inside plots.
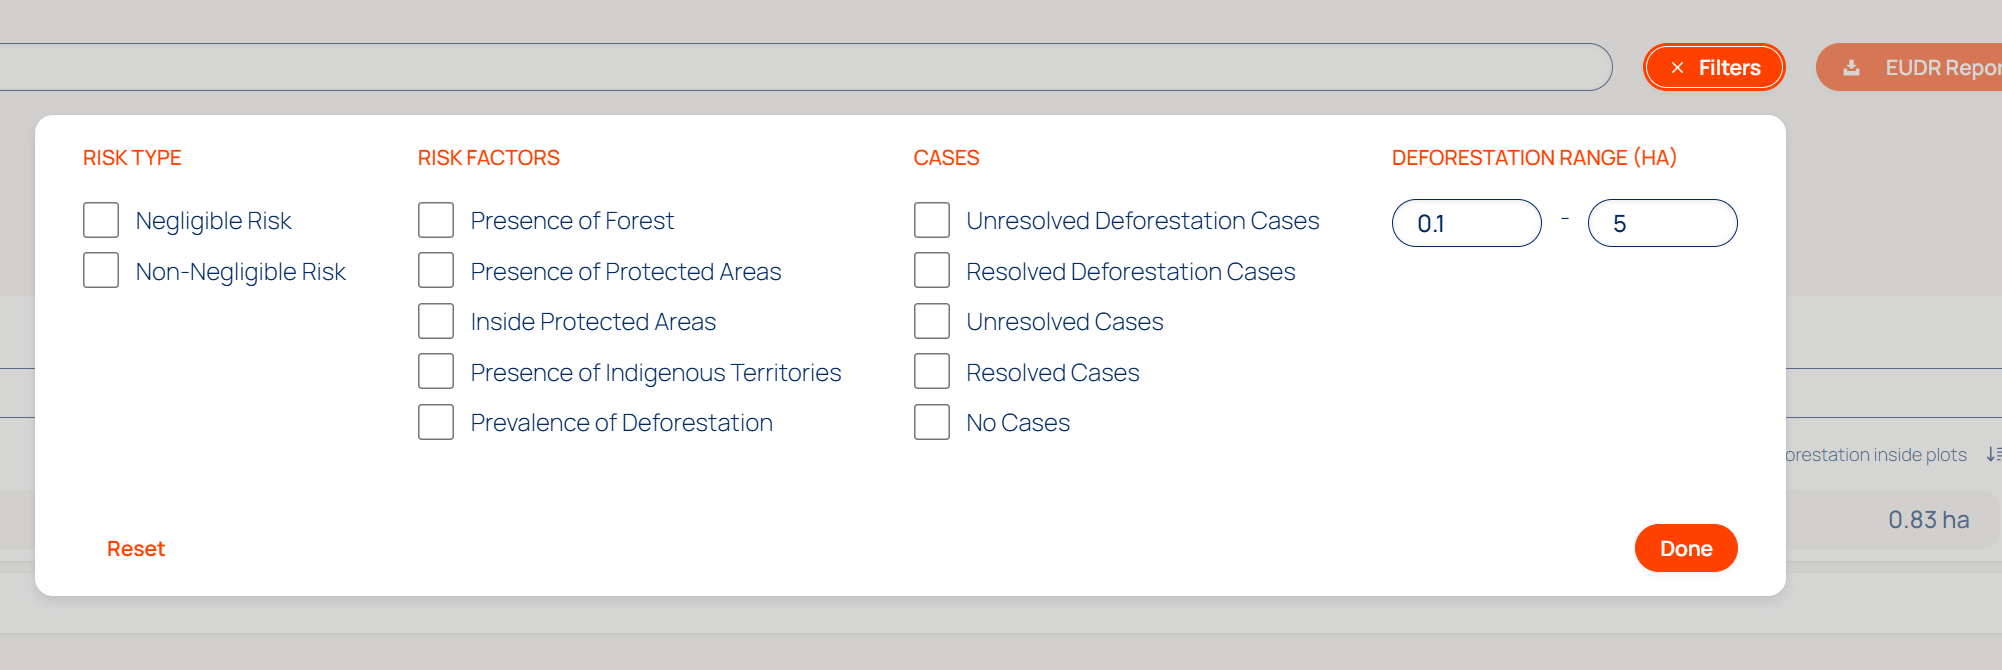
This feature was developed in response to the observation that the far majority of non DF plots in the platform is actually linked to very small amounts of deforestation. In the absence of man- and/or willpower to engage with suppliers on every deforestation allegation, this filter allows you to exclude plots with small amounts of deforestation from the Risk Assessment page.
This feature is also a prerequisite to the feature of bulk case creation workflow for supplier engagement and risk mitigation, allowing you to create cases in bulk only for those plots you actually want to engage on.
Plot Filters
Users can filter plots on the Risk Assessment based on plot quality issues, different risk factors, risk type, as well as case status.
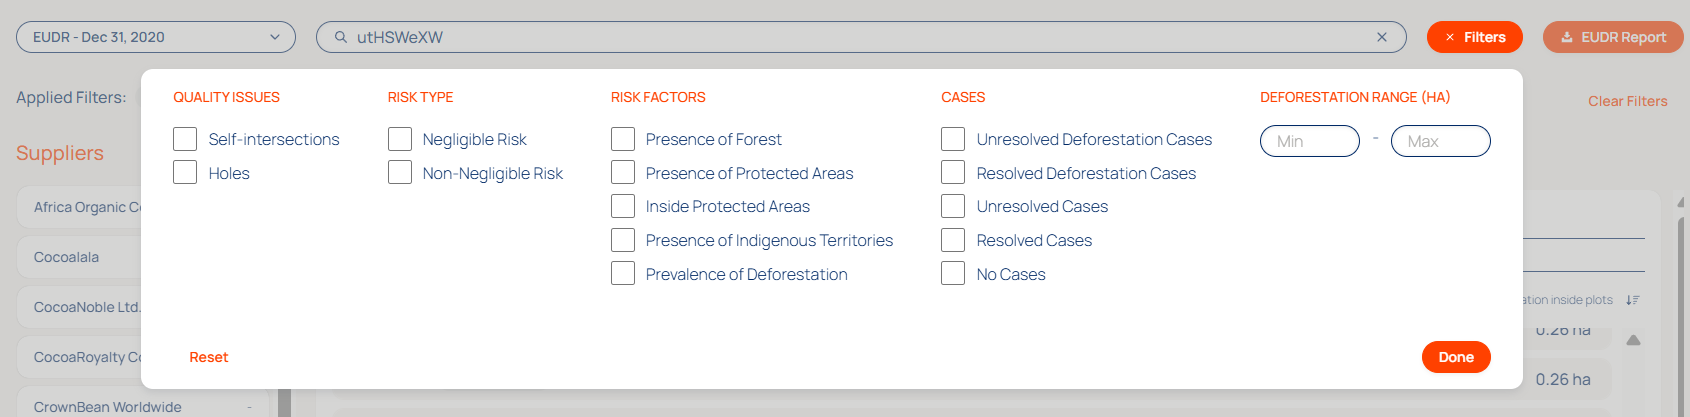
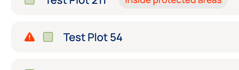
Plot Quality Issues: Plots are assessed on quality issues. Plots with issues are displayed with a small exclamation mark in front of the green or red square.
Currently three quality issues are considered, with others to be added later:
- Self intersections
- Definition: The lines of the geometry of the intersect with each other. We consider the area between the intersections, but when the shape is a large bowtie or hourglass, significant areas might be excluded in the assessment. These are best checked visually on the map. On the map the self intersection might not be visible since they can be smaller than the resolution of the map. If so the self intersection can be safely disregarded.
- Are auto fixed when submitting to TRACES: Yes. When adding these plots to a DD statement the platform cuts the geometry with the self intersection into two separate polygons (part of the same plot) that cover the same extent.
- Holes
- Definition: The polygons of a plot contain one or more holes
- Are auto fixed when submitting to TRACES: Yes. When adding these plots to a DD statement the platform cuts the geometry with the hole into two separate polygons (part of the same plot) that cover the same extent.