An always up to date, interactive map of the world displaying deforestation, forest, noncompliance boundaries, production areas and spatial supply chain entities. Same as on the Event Feed you will find deforestation events for forest loss and fire events for which we have not (yet) detected forest loss.
Navigating the map
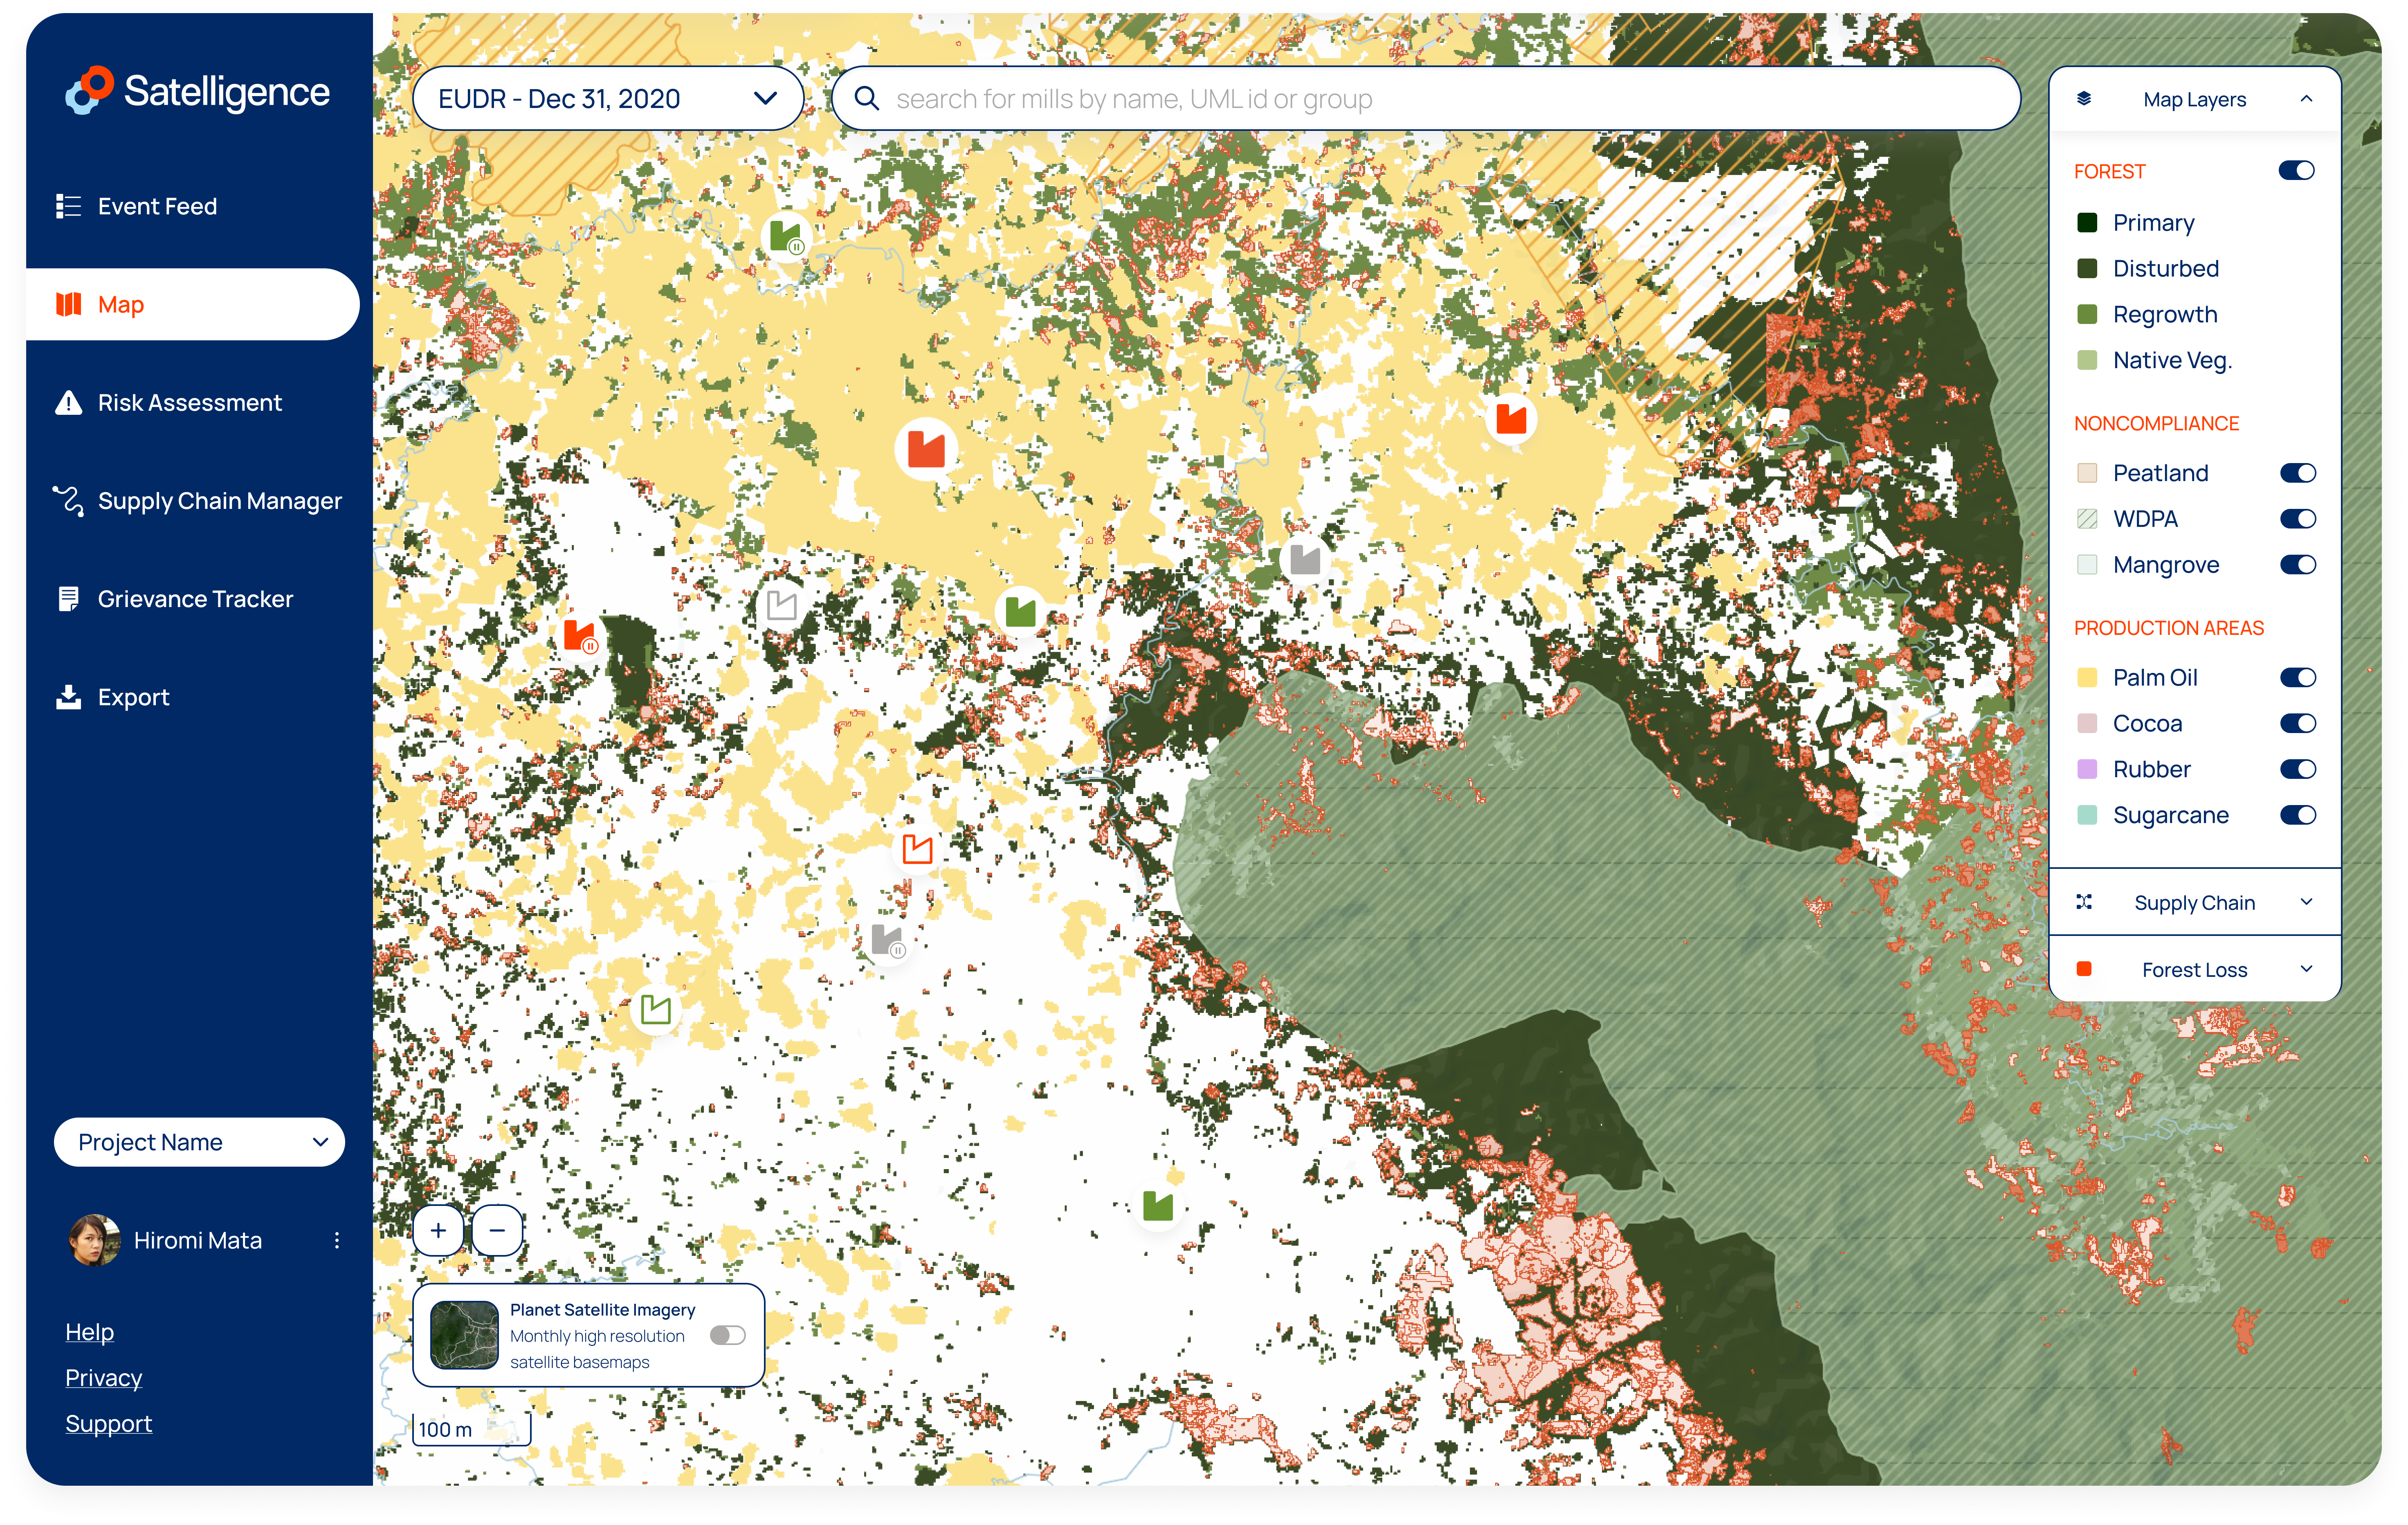
The top right of the map shows the map legend and layers. The pane allows you to switch map layers on and off for customization of the map.
The information displayed on the map is hierarchically organized as follows:
- Map layers
- Forest
- Noncompliance
- Production areas
- Supply chain
- Plots/concessions/mills, depending on your organization's supply chain
- Forest loss
- Detections
Map Layers
This section includes our land cover information, such as our remaining forest layer and commodity layers, that can be toggled on/off for more visibility using the map layers button on the map.
Forest Types
Though every tree counts, not all forests are equal when it comes to tackling deforestation in supply chains. In some instances, events may only involve changes in forests that were degraded earlier or fires inside commodity production areas.
Identifying the type of forest that has been affected by an event, allows you to prioritise events in your event feed and focus on areas that are most at risk of affecting your supply chain.
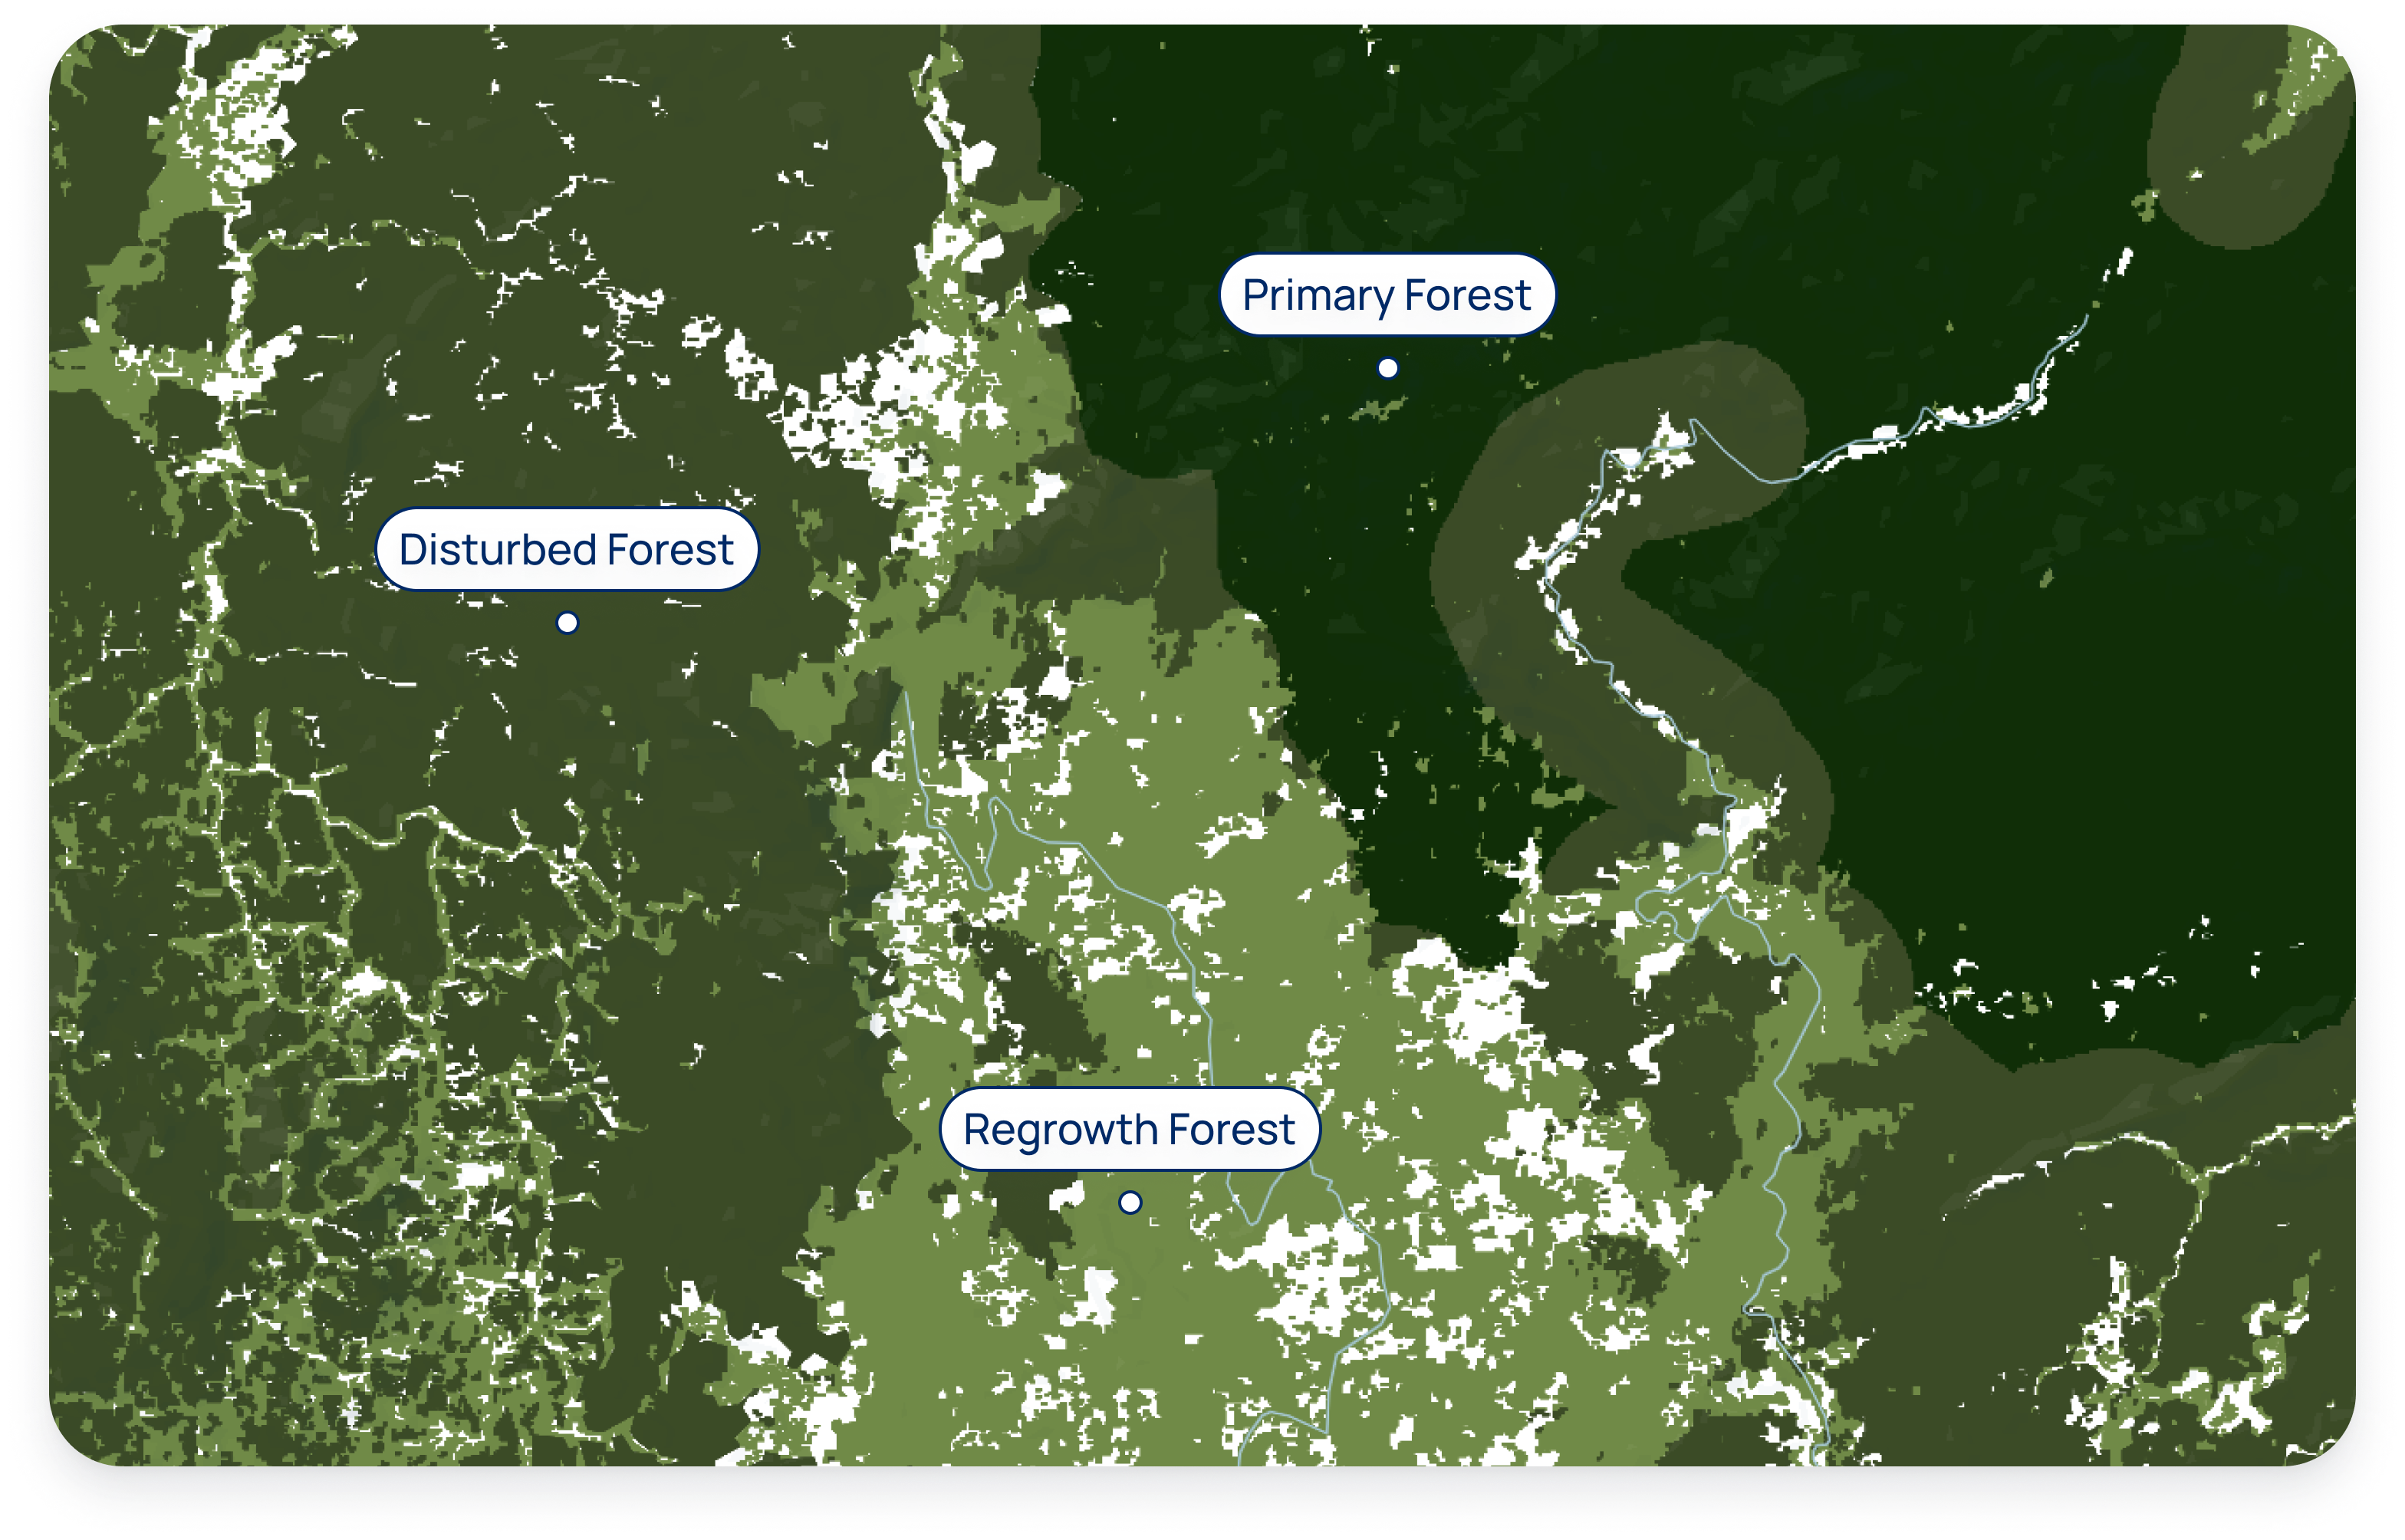
Primary forest: Large intact, unfragmented forest areas with insignificant human activity such as logging, forest management, or conversion; including native biodiversity and unbroken expanse of natural ecosystems. This includes High Conservation Value (HCV I Species Diversity) and High Carbon Stock (HCS) High Density Forest.
Disturbed forest: Intact forest affected by some human activity but with limited or older disturbance, such as logging or forest management. This includes HCV II (landscape-level ecosystems, ecosystem mosaics and IFL) and HCS medium- and low density forest. This layer typically includes many logging concessions that have been actively logged in the recent past, and therefore cannot be classified as primary forest.
Regrowth forest: All remaining forest that cannot be classified as either primary or disturbed, including secondary forest through reforestation, or afforestation after other dominant land use. A secondary forest is a forest that has been logged or heavily degraded and has recovered naturally or artificially. This layer typically has a lower conservation value, and includes HCS Young Regenerating Forest.
Non compliance
The non compliance section contains land cover layers that have a special status in addition to regular forest classes. Examples include peat, mangrove, protected areas and indigenous territories.
Production areas
Depending on your organization settings you will have specific commodity maps available. The layers can be toggled on and off.
Supply Chain
An interactive legend expands when clicking on the supply chain button. If you are monitoring cocoa you will find plots on the map. If you are monitoring oil palm supply chains, you will find plots, concessions and mills. Concessions are either independent (a vertical hash) or associated with a mill (a diagonal hash). A mill association is determined when a mill sits inside a concession or when the concession has a group level affiliation with the mill within a 100km of the mill.
Upon selection of supply chain entities an info panel will show available information on the supply chain entity. When an aggregator is selected, the map will highlight and pan to all related plots that are supplying the aggregator.
Forest loss
The forest loss section contains all map layers related to the loss of forest. Currently there are two map layers available for toggling on and off:
-
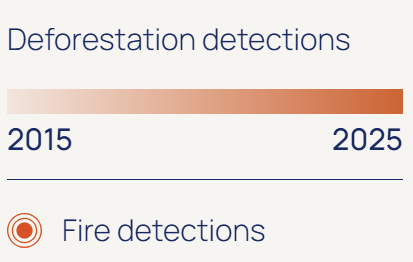
Deforestation detections
-
Jurisdictions
Detections
Detections show the loss of forest over time on the map. The shade of red indicates the recency of the deforestation with darker red colors resembling more recent deforestation. The Satelligence deforestation detection system contains more information on how detections are created.
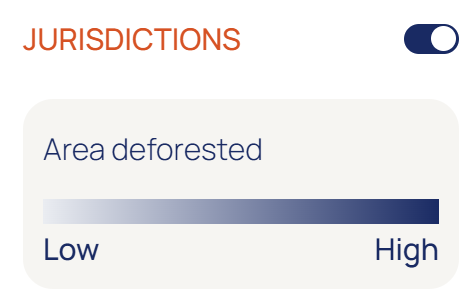
Jurisdictions
A Jurisdictional deforestation layer is available since the EUDR cutoff date. The layer is intended to give you an indication on sourcing risk and need for intervention for particular sourcing regions. Jurisdictions are classified in low to high deforestation risk based on the prevalence of deforestation in relation to the size of the jurisdiction.
Follow the steps listed in interacting with the jurisdictional deforestation risk layer.
Interacting with the jurisdictional deforestation risk layer
Satellite Basemap Switcher
Enjoy switching between Planet’s monthly basemaps to view generic nuances of land cover types and analyse historic deforestation. A toggle is available to turn on/off the Planet Satellite Layers. When investigating an event, the basemap selection on the timeline matches the one the selector and vice versa. When the satellite layer is on, the forest loss (detection outlines) can be also toggled on/off.
Search Bar
If you would like to verify a grievance that has been raised by a third-party for a specific location, you can type in the coordinates in the search bar as latitude, longitude. Example: 2.587, 98.548 takes you to Sumatra Indonesia for further fact checking. You can also use the search bar to navigate to cities and points of interest or browse the map using your mouse or keyboard, it is fully interactive.
Event Investigation
Events & Detections
An event represents an aggregation of detections, which are geometries of forest loss polygons or fire hotspots. Deforestation detections have a temporal resolution of one day, and are aggregated into one event when they take place within a radius of 250 meters and 45 days. When an event has no further developments for 45 days, newly detected deforestation will translate into a new event. A forest cover change event must be a minimum of 1 ha for it to be included in the event feed.
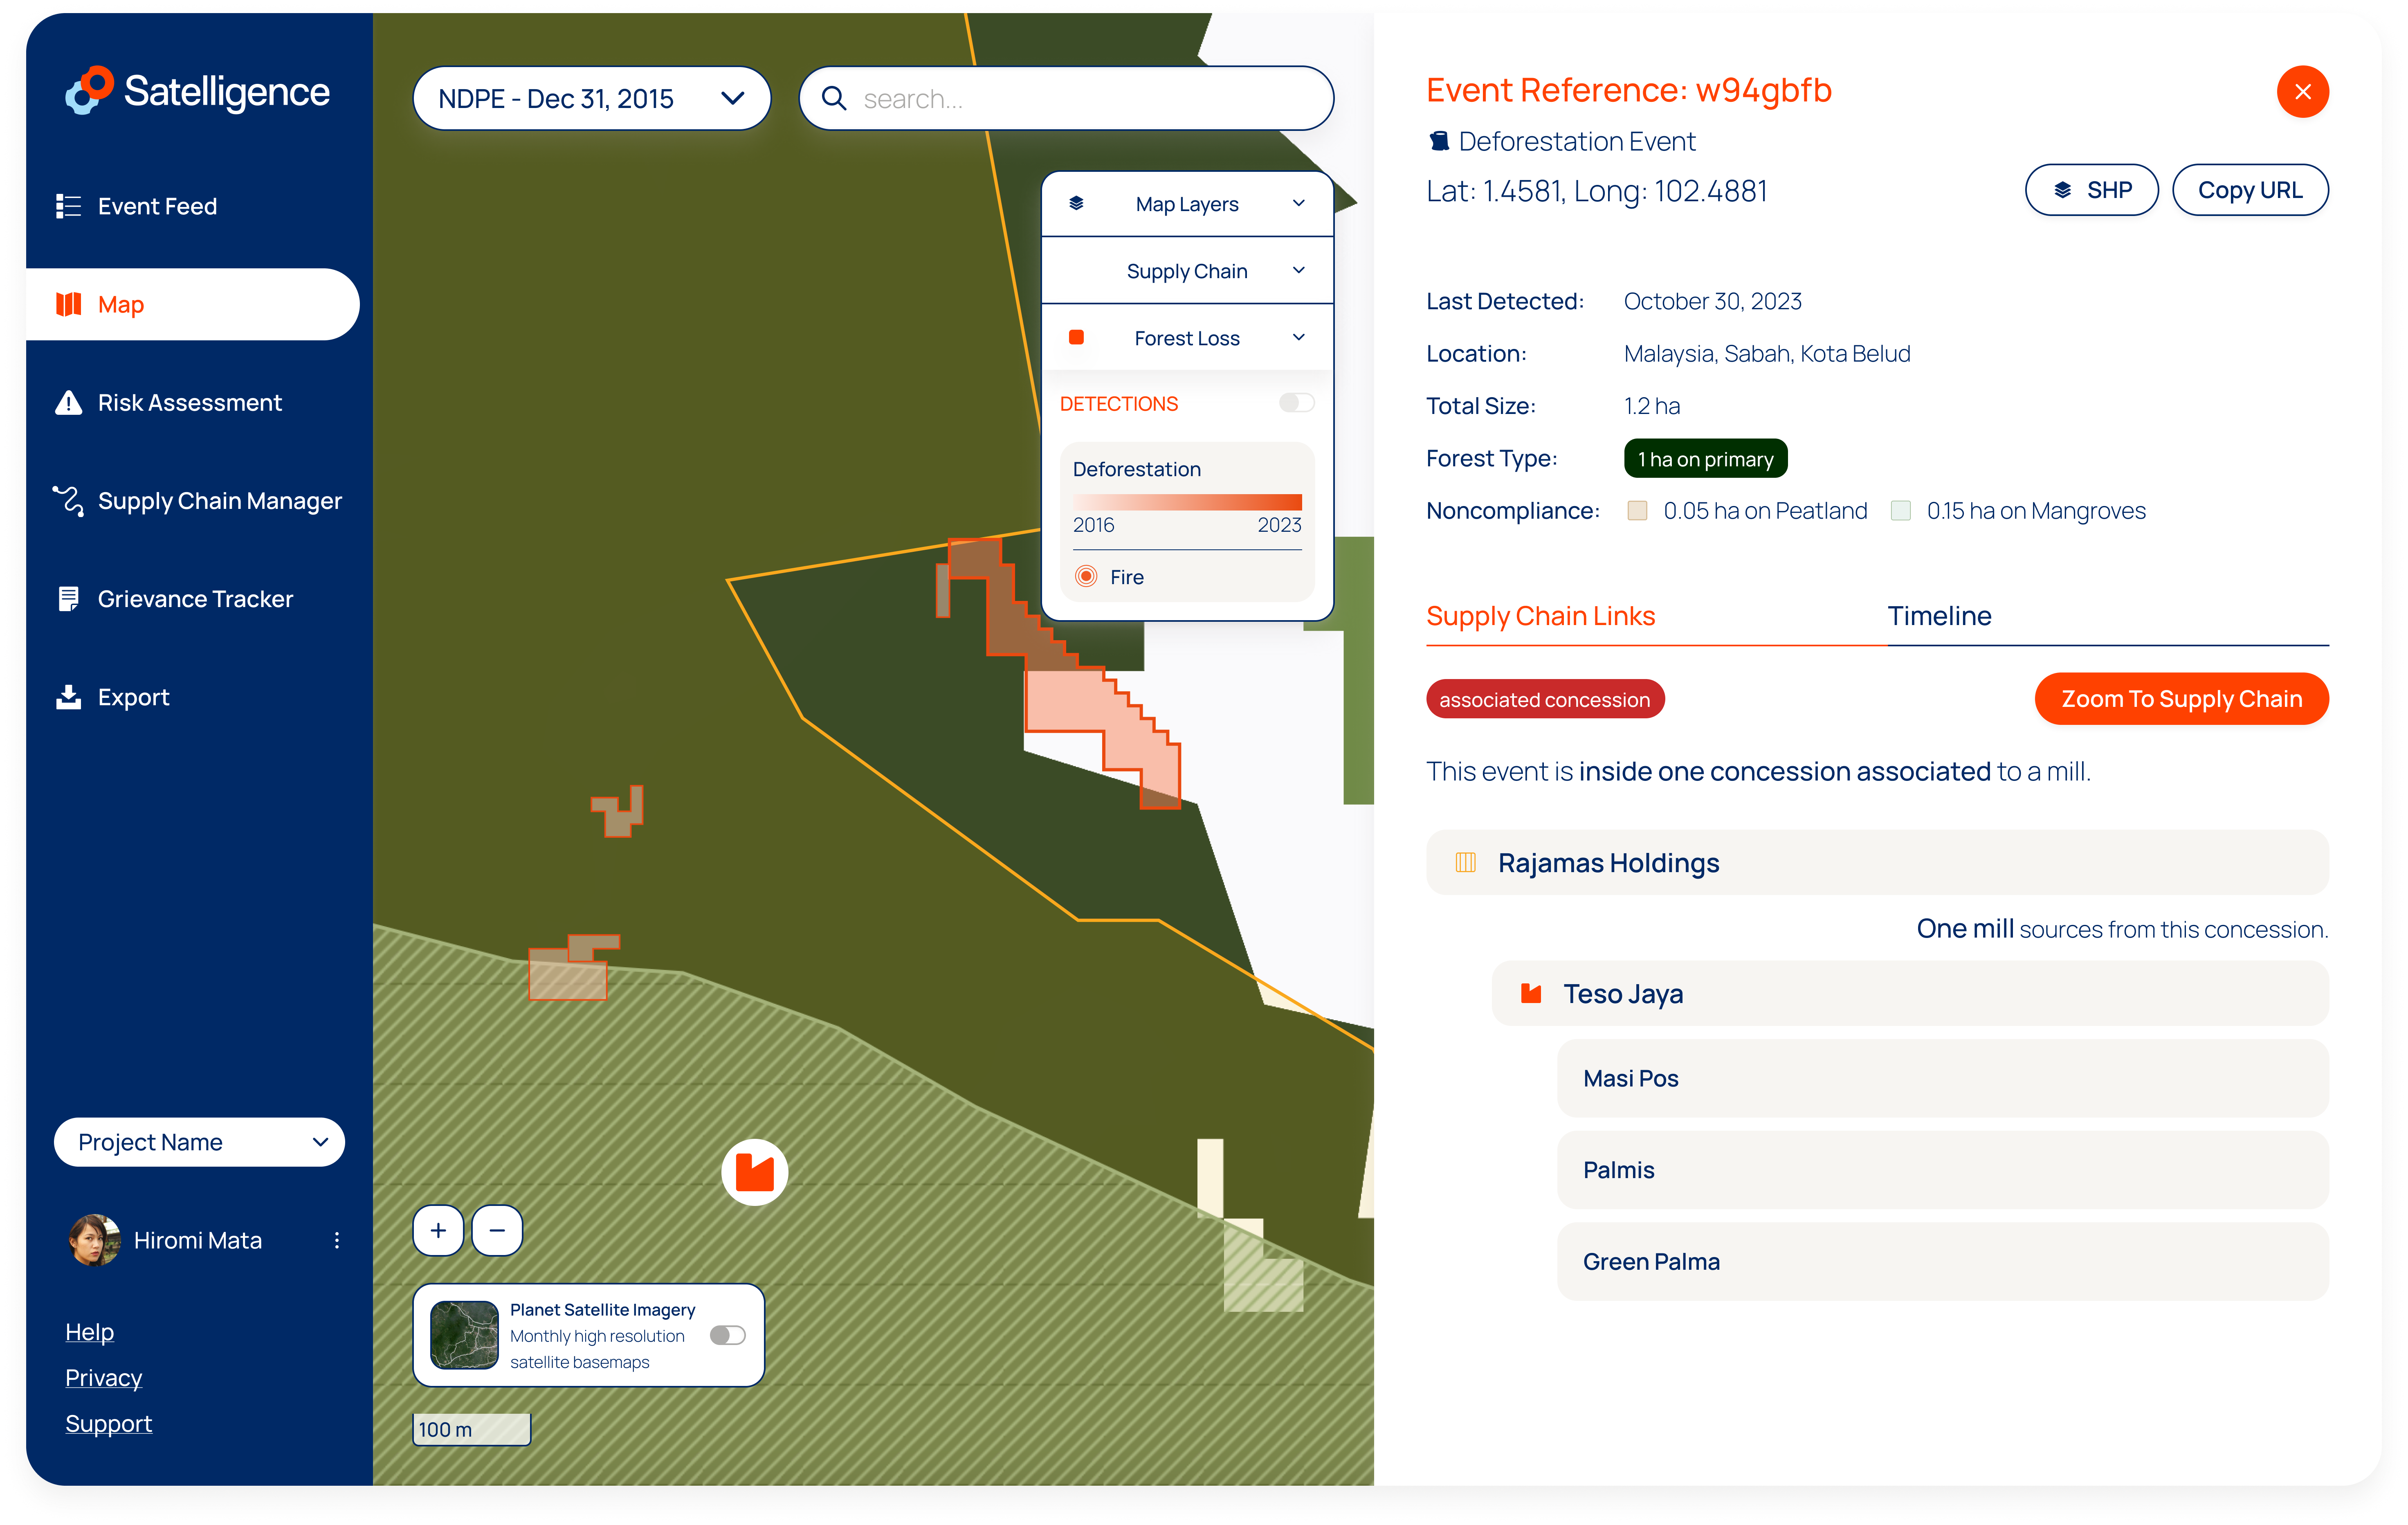
Supply Chain Links
To investigate how an event relates to your supply chain, click on the Supply Chain Links tab. If the data is available in the Satelligence database, it will show you the name of the concession, and name(s) of the relevant mills in the area. On the map, you can also click on the mill icon to access more information about the mill. On the right hand side, more information will be displayed regarding the supply link.
Share Event
Click on Copy URL to share the event with someone else in your organisation or to bookmark the url to come back later. New detections will update the event, but using the link you can always return to the same spot.
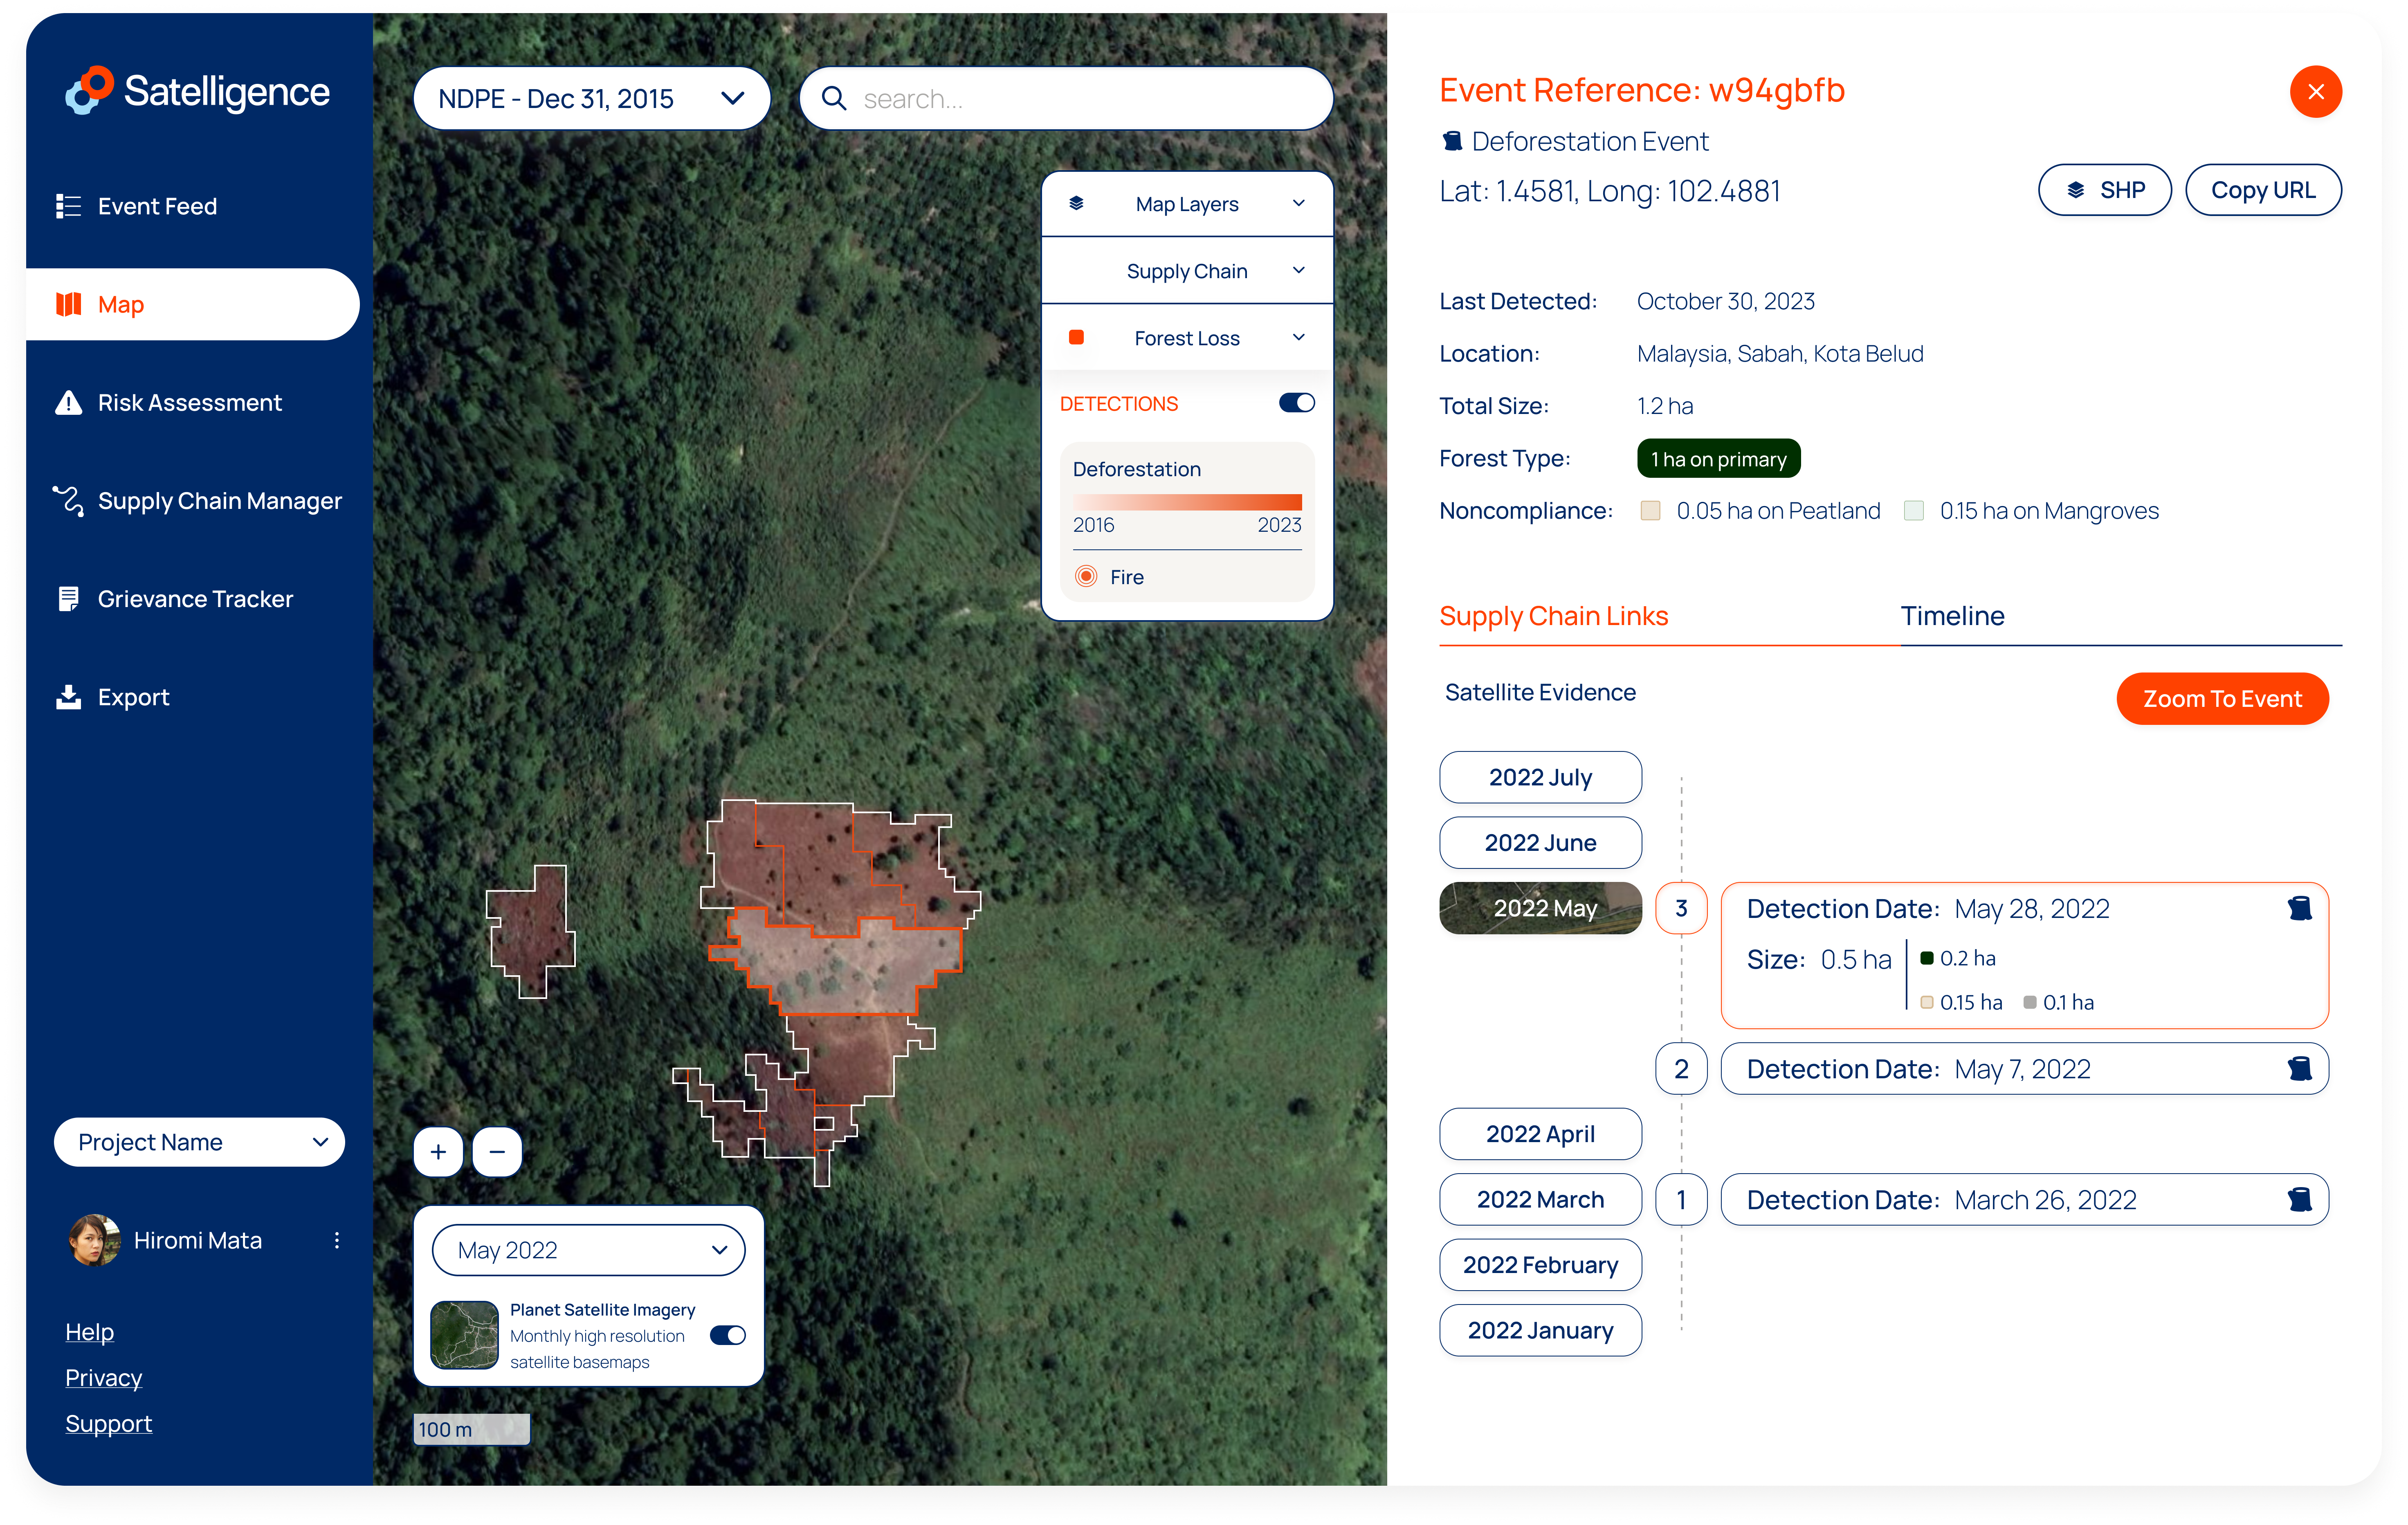
Detection Timeline
The timeline shows how an event progressed over time. You can click through the individual detections that were picked up by satellites and form a single event.
Satellite Imagery
To see high resolution Planet satellite imagery of a forest cover change event, click on the month-year button on the timeline.
This allows you to see the physical forest cover change before and after an event.
Should you want to engage your suppliers to address a particular event, you can send a before and after screenshot of the event using this functionality.
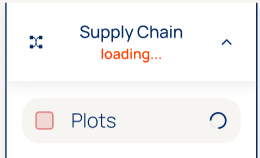
Plot layer updates
When users upload new plots to your supply chain, the map will be updated. Updating plots on the map can take a couple of hours depending on the amount of new plots. While the change is in progress, the existing plots will remain visible on the map. A loading indicator will notify you about the fact that an upate to your map layer is in progress.