
The Satelligence Harmonized Nature and Commodity baseline (H-NCB) is a 10m resolution global landcover map that includes the presence of different forest types and other native vegetation classes, as well as the presence of different commodities. Satelligence creates the best in class land cover maps because it is fundamental to all derived products like change detection and biomass estimations. In a 2025 evaluation, The Alliance of Bioversity International and CIAT concluded the Satelligence H-NCB offers the most robust and comprehensive land cover map available.
Satelligence uses a hybrid approach for nature and commodity baseline creation. Meaning that both i) open data such as the Tropical Moist Forest Layers from JRC, as well as ii) Satelligence proprietary data, are used.
Baseline creation
Forest, as defined by the FAO is “land spanning more than 0.5 hectares with trees higher than 5 meters and a canopy cover of more than 10 percent, or trees able to reach these thresholds in situ. It does not include land that is predominantly under agricultural or urban land use.”
Satelligence applies machine learning-based forest classification models, trained to enable consistent application of these parameters. Within the forest domain, our baseline identifies the following forest classes in order to distinguish high risk deforestation from lower risk deforestation:
Primary forest - We implement the widely adopted concept of Intact Forest Landscapes (IFL) to define primary forest. IFL are defined as large, unfragmented forests with minimal human influence, i.e. not altered by logging, forest management or conversion: “unbroken expanse of natural ecosystems within the zone of current forest extent, showing no signs of significant human activity and large enough that all native biodiversity, including viable populations of wide-ranging species, could be maintained.” Primary forests have a minimum area of 50,000 hectares, a minimum patch width of 10 km, and a minimum corridor/appendage width of 2 km. Our primary forest class includes High Conservation Value (HCV I) and High Carbon Stock (HCS) High Density Forest. RSPO, FSC, RTRS, some national legislations and NDPE policies forbid clearing of primary forests.
Disturbed forest – Disturbed forest is moist or dry tropical forest. We define this class as intact forest with some human influence, i.e. disturbed due to logging, forest management, including smaller patches than IFL. We use the primary forest layer developed by the University of Maryland (UMD) for 2001, in combination with the JRC Tropical Moist Forest layers and National Forest maps. These are subsequently corrected for any clearing up to the desired cutoff date. All corrected UMD primary forest outside of the IFL that has never been cleared, qualifies as disturbed forest. This layer includes many logging concessions that have been actively logged in the recent past, and as such, does not meet the qualification of primary forest. Our time-series analysis, based on the full historical satellite dataset from 1984 to now, has not detected any significant disturbance. Our disturbed forest class is predominantly HCV II and HCS medium- and low density forest. In some cases, although legally allowed, clearing of this disturbed forest is not accepted under NDPE policies.
Regrowth – This includes all remaining forest that is not primary or disturbed, or areas afforested or reforested after other dominant land use. This is all forest under the FAO definition that does not fit the other 2 forest classifications. We define heavily degraded areas as <10% canopy cover, with disturbance evident from the satellite time-series signal over a short time period (less than 2.5 years). Our time-series analysis can detect such change over the full historical satellite dataset from 1984 to now. Regrowth areas remain forested land covered by existing or regrowing trees. Apart from heavy logging, drivers include fires, and other damage to canopy from hurricanes, droughts, and blowdowns. Our regrowth forest class includes Young Regenerating Forest, whether it is HCV needs to be assessed locally. Clearing is often legally allowed, and can be accepted under NDPE policies if not HCS and/or HCV. A growing number of grievances are found within this class.
Dry Forest are a type of ecosystem characterized by a distinct wet and dry season, with a prolonged period of little to no rainfall. Dry and seasonal forests are present across Central and Latin America, Africa, India, Thailand, Vietnam, Cambodia, Laos Philippines, Indonesian South, and East Timor.
In early 2025, Satelligence added a dry forest baseline to further refine and update its dataset and reduce the overall number of false positives and false negatives in dry and seasonal forests. This includes predominantly coffee and cocoa growing regions across Central and Latin America, and Central and East Africa in particular. Countries where dry forest was added includes: Colombia, Costa Rica, Democratic Republic of the Congo, Ecuador, Ethiopia, Guatemala, Honduras, Kenya, México, Nicaragua, Peru, Puerto Rico, Rwanda, Tanzania, and Uganda. Most open source datasets do not include dry forest classes, which results in overestimation of deforestation and emissions.
Native vegetation –The combination of all forest and savannah classes defined in the MapBiomas layers, where (1) it does not intersect with UMD Primary Forest and IFL polygons, and (2)) it does not exceed the EUDR thresholds of 10% coverage and 5 m height. If condition (2) does not hold, it is upgraded to "Dry Forest". This class is currently available only for South America.
Additionally, the Satelligence baseline also includes non-forest natural lands. Specifically, it supports Shrubland, Grassland and Wetland classes. The last two are primarily based on the Global Pasture Watch and the Global Wetland Database, respectively. Shrubland is currently based on the Global Land Cover and Land Use Change dataset, as well on forest data filtered e.g. based on EUDR rules.
Commodity mapping
Commodities, in particular perennial commodities such as oil palm, cocoa, coffee and rubber, are often misclassified as forest. Therefore, commodity maps are essential to create a highly accurate classification of forest and other natural lands, which forms the basis of our deforestation and conversion products.
Satelligence’s commodity maps provide a consistent view of where forest-risk crops such as cocoa, palm oil, coffee, and soy are grown. These maps are designed to support supply chain traceability, deforestation risk assessments, and carbon emissions calculations—particularly in the context of regulatory frameworks like the EU Deforestation Regulation (EUDR).
Our approach combines open-source satellite imagery (e.g. Sentinel-1, Sentinel-2, Landsat) with supply chain asset data and labeled training datasets. Using a supervised classification approach, we identify crop-specific land use based on spectral and radar signals. All maps are built at 10-meter resolution and updated annually or seasonally, depending on crop dynamics.
Each map is tailored to the commodity and country context. For example, in West Africa, the cocoa map distinguishes agroforestry systems from natural forest, and in Southeast Asia, palm oil is differentiated from similar vegetation such as coconut and natural forest. Public land cover datasets often misclassify these crops, which introduces errors in deforestation reporting. Satelligence addresses this by integrating local ground knowledge and post-processing routines to improve accuracy.
Accuracy is benchmarked against third-party datasets and national standards. In Côte d’Ivoire, our cocoa map outperforms publicly available baselines and aligns with external assessments such as CIAT and WCF (2025). In other contexts, such as palm oil in Latin America, Satelligence identifies planted areas missed in the majority of public datasets.
Global versus Regional Models
Satelligence includes all available and commercially usable third-party datasets for commodities. All datasets are reviewed and merged with other datasets according to specific rules that ensure that the final product is consistent and coherent.
As quality training data for commodities is scarce and expensive to acquire, commodities are often classified using a global model, despite having training data only for specific regions. At Satelligence, we strive to use all data of “sufficient” quality. This is both based on published accuracy metrics, as well as an ad-hoc evaluation performed by our data scientists and commodity mapping experts.
At the same time, Satelligence always aims to work with regional models. Whenever possible, client plot data is leveraged to have more local training data and hence improve on the final classification. As for third-party models, we use both validation metrics and an expert judgment assessment to determine if a classification is of enough quality to be used in production. Based on our experience, the combination of the two is more accurate than relying on accuracy metrics alone
Acceptance Criteria
Satelligence works with and harmonizes a large amount of third-party datasets produced by scientific institutions, smallholder associations, NGOs and governmental agencies, and further complements that with in-house classifications. Each institution works with different means and aims, from scientific accuracy and reported uncertainties to pragmatic methodologies relying on self-reported data directly provided by smallholders. Satelligence leverages any data that is deemed of “sufficient quality”.
The threshold for “sufficient quality” is dynamically determined based on the dataset itself and depending on the scarcity of the data mapped in the target region. For example, if a commodity map is completely missing for a target region, lower quality will be accepted due to the absence of better data (e.g. cocoa in Brazil). Conversely, only high quality is accepted for data that has been mapped before by different parties (e.g. oil palm in Indonesia and Malaysia).
Satelligence is working towards having a validation dataset for key commodities at global scale. This is slow work, as training and validation data for commodities is very scarce. In the absence of validation data, our evaluation process builds on ensuring consistency and coherence across datasets, and correcting them when needed. A practical example can clarify the approach.
Consider a new coffee classification for the year 2020 that predicts coffee in a target area, produced without any uncertainty or peer-review process. A previously peer-reviewed publication instead predicted forest in the same target area for the year 2022. In this case, we may use the new classification generally, but we use the peer-reviewed publication to correct it, since it is not possible to have forest in 2022 where there was coffee in 2020, and we trust a peer-reviewed publication more. However, if the coffee classification covered areas unmapped before, we may still use the map, but use other means to constraint the potential false positives (such as checking low resolution data like MAPSPAM or CROPGRIDS, and national harvest estimates from FAOSTAT). Furthermore, we always quality check every dataset visually and use our expert judgement to find the best way to use it, or reject it.

Combining different harmonized maps together
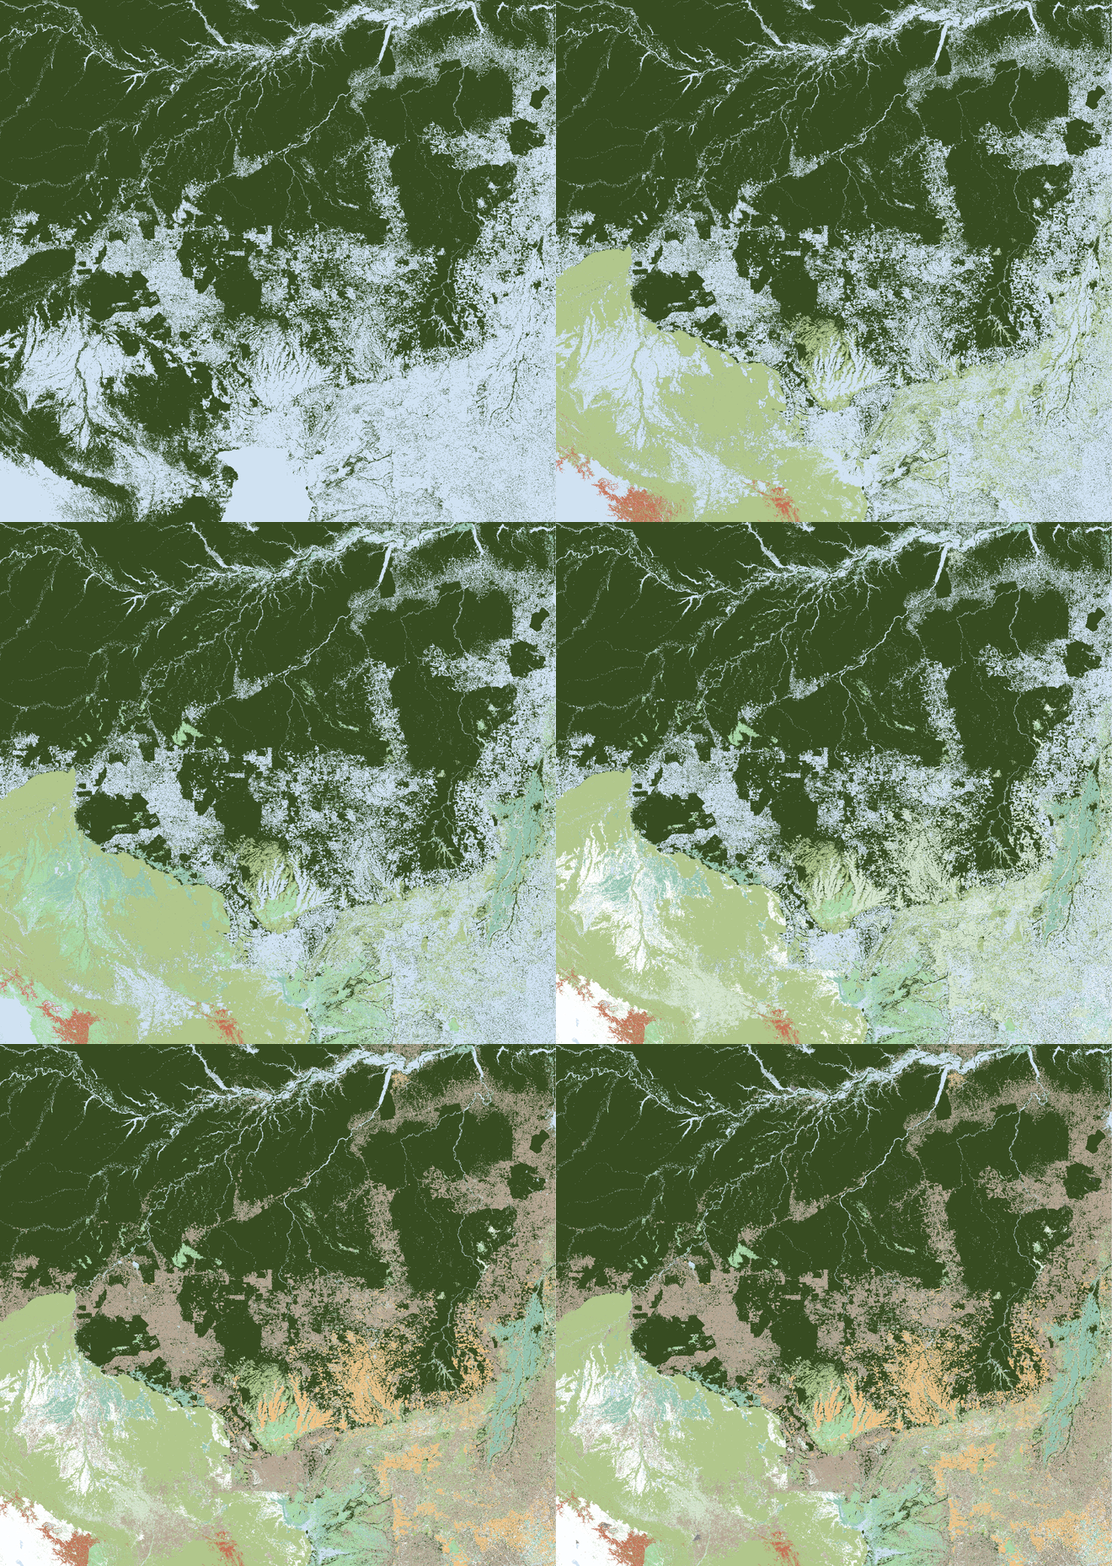
Extracting forest classes from individual maps and stacking them
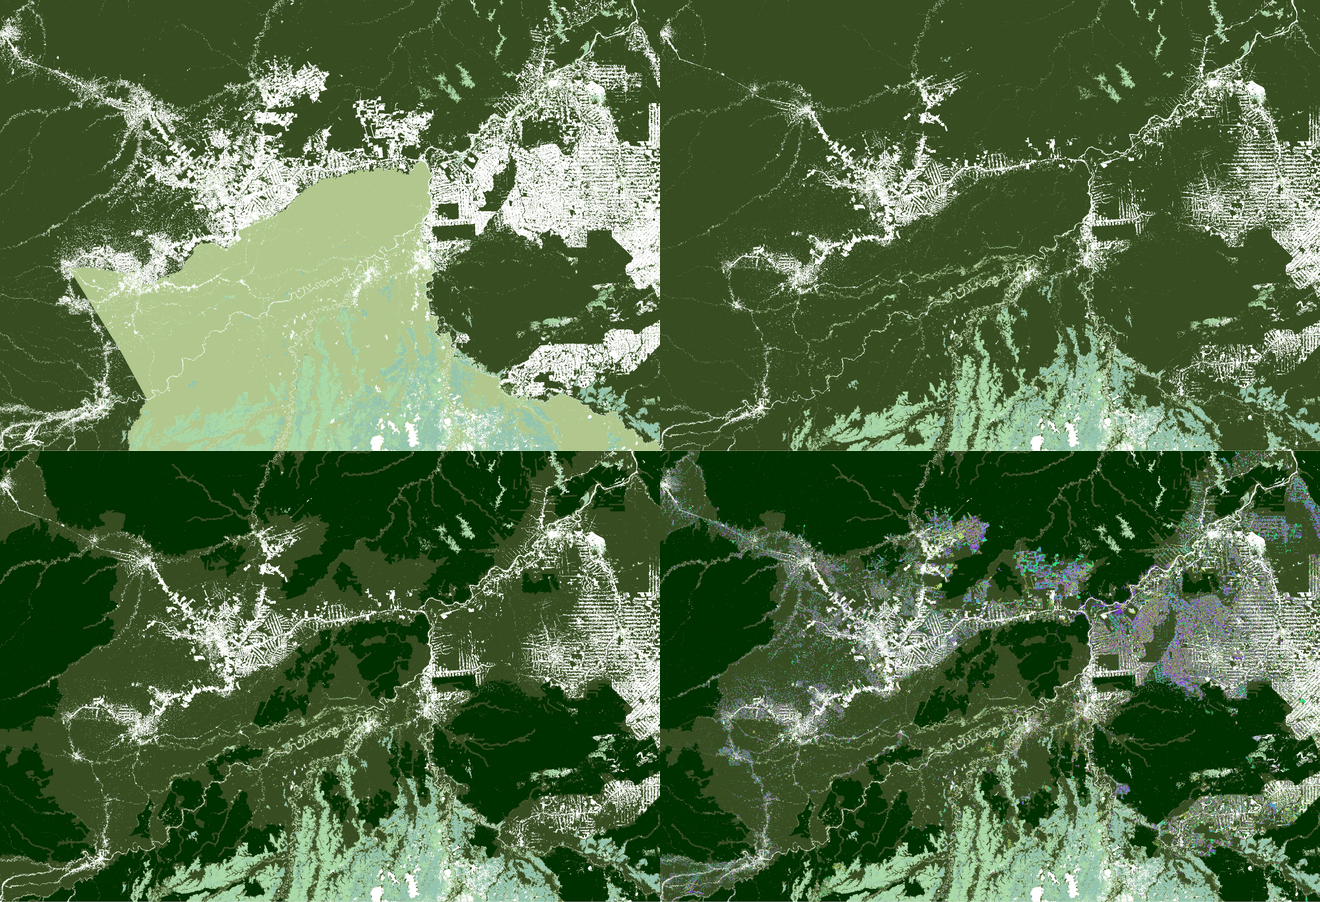
Defining Primary & Disturbed and removing deforestation/degradation
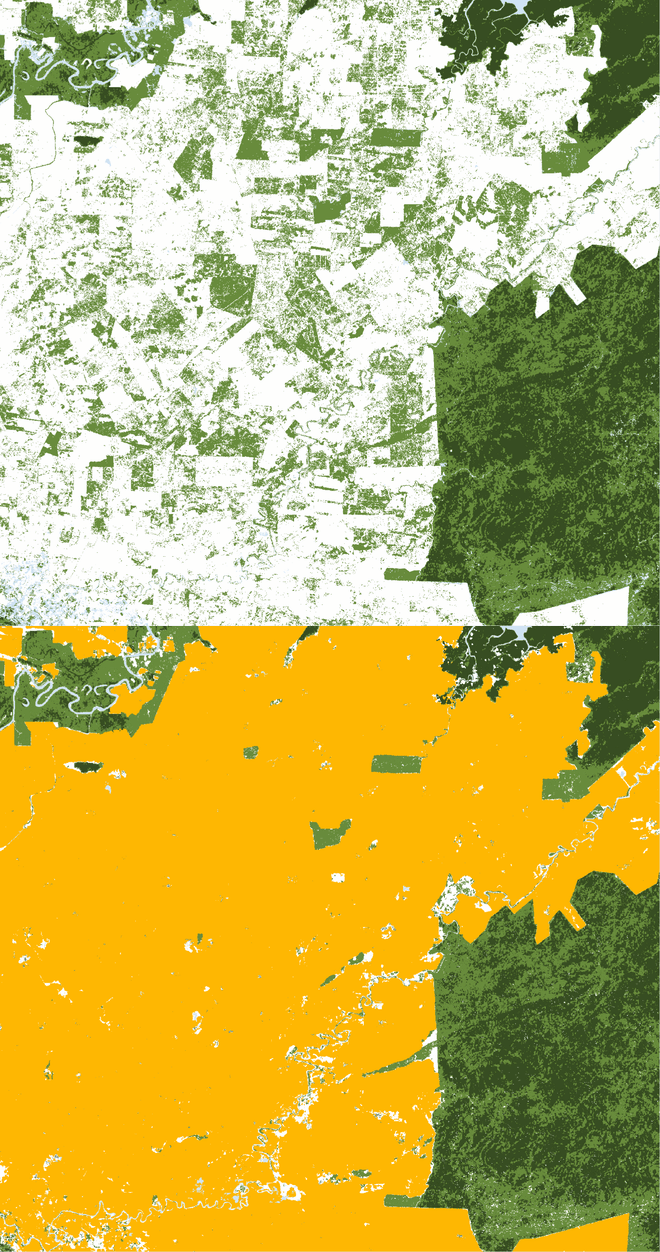
Overlapping Commodities over Forest to remove false positives
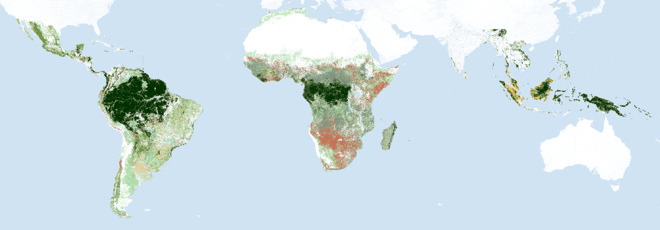
The Satelligence Harmonized Nature and Commodity Baseline (v5)
References
- C. Vancutsem, F. Achard, J.-F. Pekel, G. Vieilledent, S. Carboni, D. Simonetti, J. Gallego, L.E.O.C. Aragão, R. Nasi. 2021. Long-term (1990-2019) monitoring of forest cover changes in the humid tropics. Science Advances
- Turubanova S., Potapov P., Tyukavina, A., and Hansen M. 2018. Ongoing primary forest loss in Brazil, Democratic Republic of the Congo, and Indonesia. Environmental Research Letters
- Potapov P., Yaroshenko A., Turubanova S., Dubinin M., Laestadius L., Thies C., Aksenov D., Egorov A., Yesipova Y., Glushkov I., Karpachevskiy M., Kostikova A., Manisha A., Tsybikova E., Zhuravleva I. 2008. Mapping the World's Intact Forest Landscapes by Remote Sensing. Ecology and Society, 13 (2)
- HCSA Toolkit 2.0