
The Data Manager is where data supply chain data and documentation enters the platform and where outgoing data is managed and stored. This section comprises of three sections:
- Suppliersto manage your suppliers and their plots. This is where you maintain up to date traceability data on your supply chain.
- DD Statements to track, store and submit Due Diligence Statements including the data from suppliers.
- NEW Seasons to store a snapshot of your supply chain in time to make an audit-ready archive
The Supply Chain section of the Data Manager allows you to add suppliers and upload plots and mills per supplier. If you already have a Satelligence account then your supplier column will be pre-populated.
Without any suppliers in the platform, there are two options:
- Start with adding your first supplier.
- If you already have a compiled dataset of your supply chain data, such as a mill list or a file with all the plots of all your suppliers, you can contact support@satelligence.com and our support team can ingest the dataset in one go and save you a lot time. This is especially useful when your dataset covers many suppliers.
A maximum of 1,000 suppliers is currently supported. If you have more than a 1,000 suppliers, please contact support@satelligence.com.
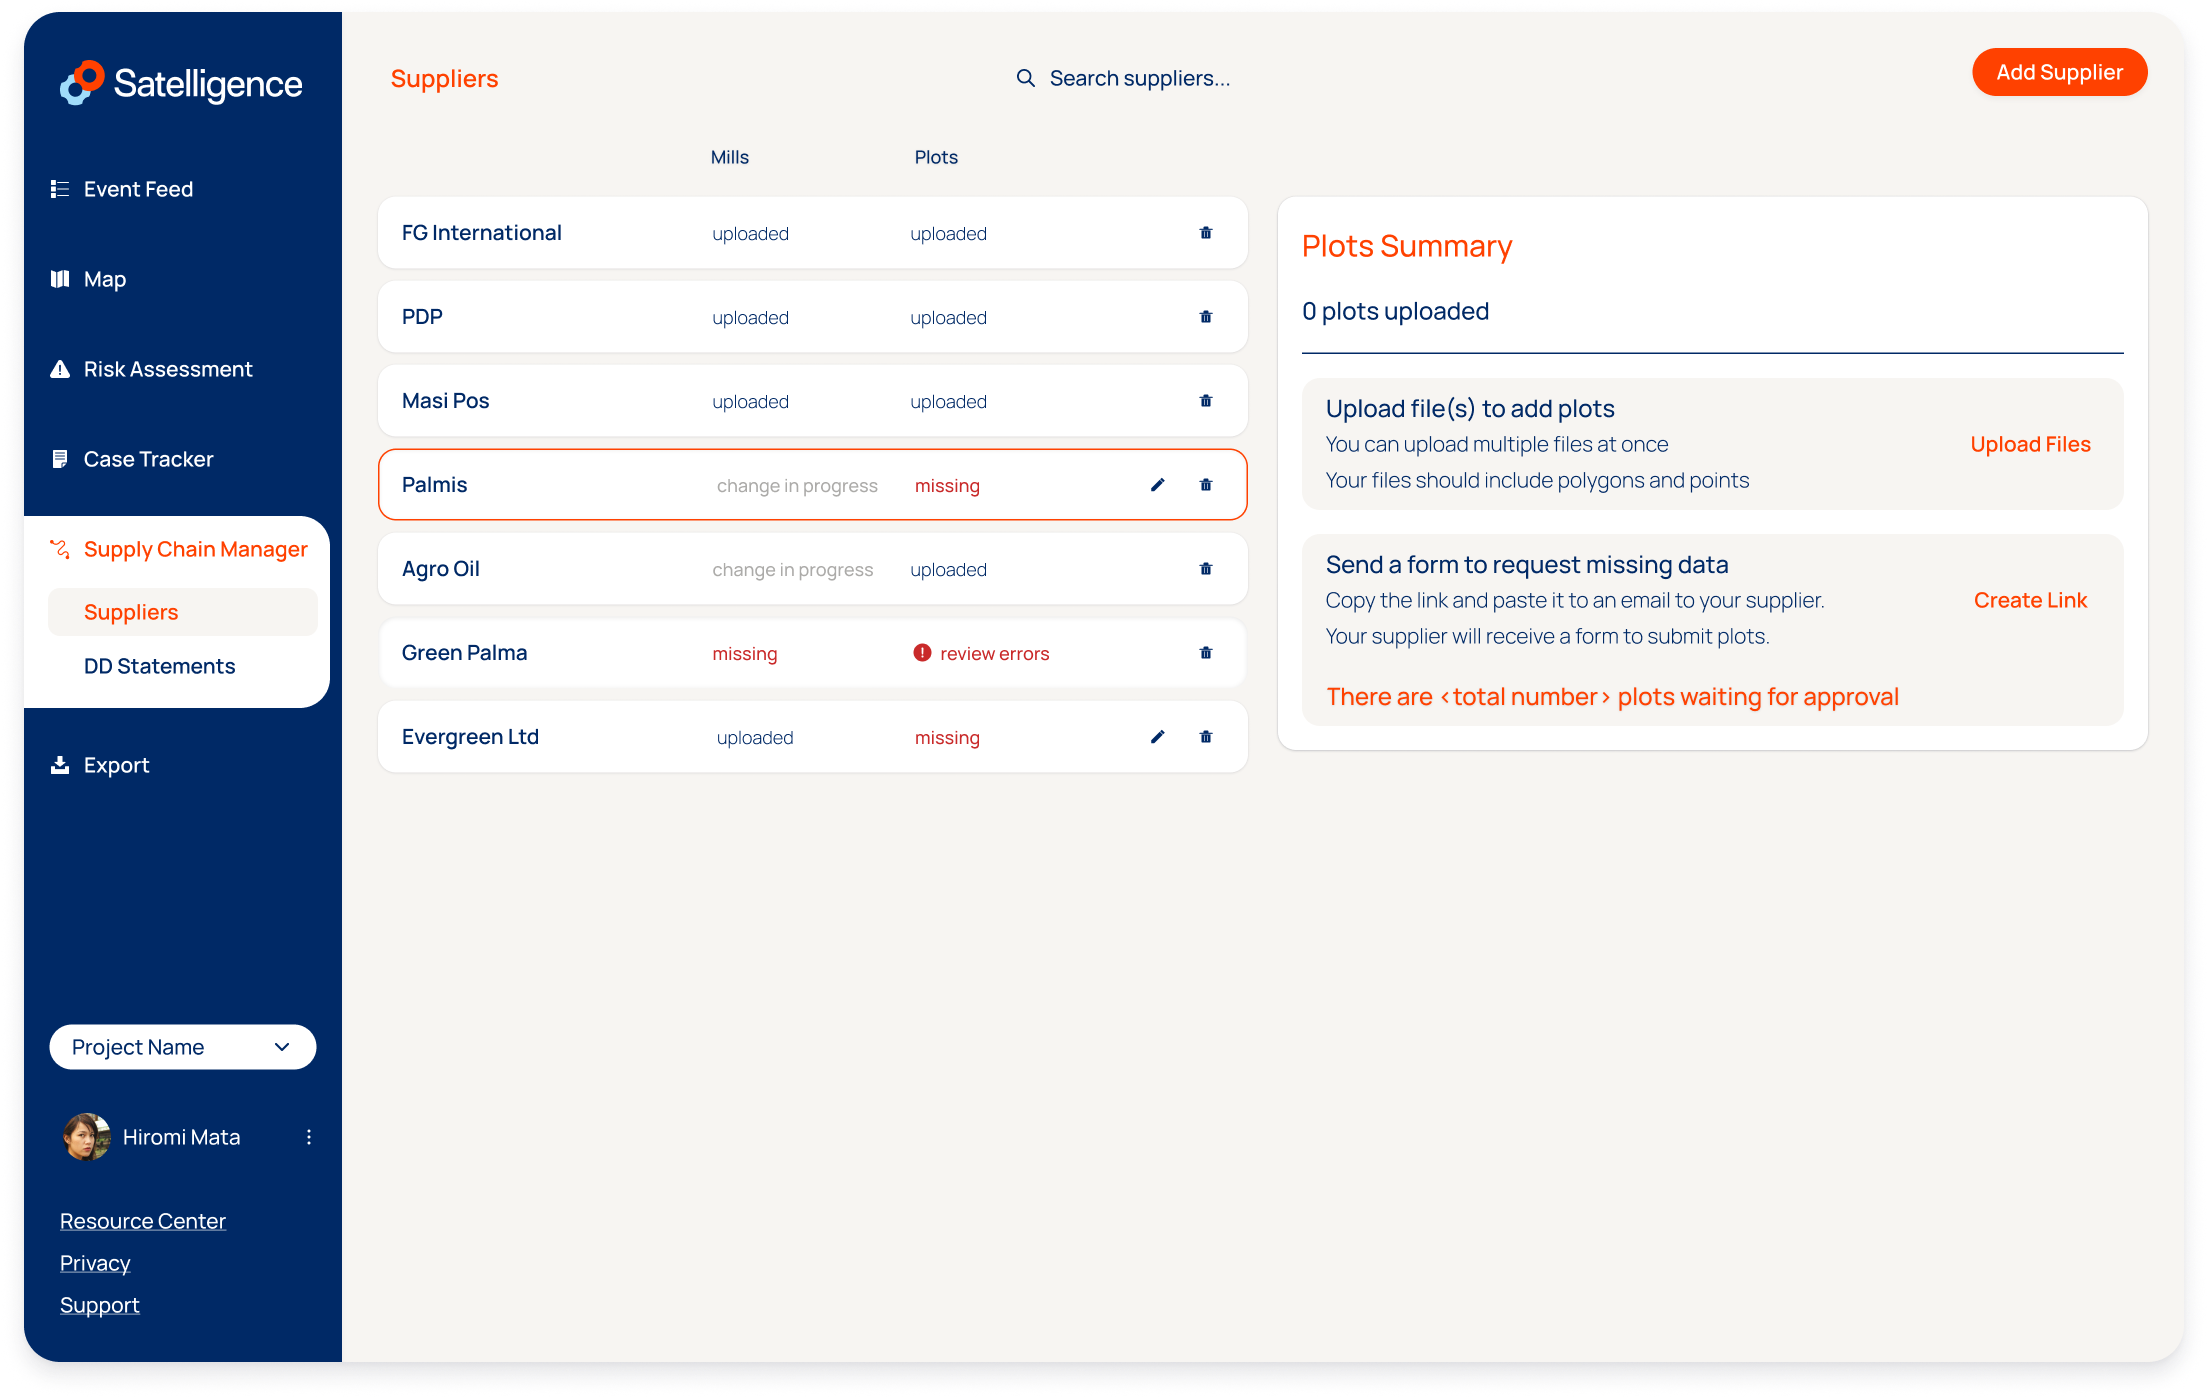
When you add your first supplier, you will be prompted to give the supplier a name. Type the name and press enter or click on Submit to proceed or the blue cross to cancel. You can always remove a supplier after creating it.
📋 It's best to add all your tier one suppliers using the same naming convention you have internally for consistency; it's a free text field so you can also use the supplier field for indirect suppliers. We use the suppliers to group plots and to provide overview stats on the overall deforestation risk and compliance.
Geolocation data requirements
File type
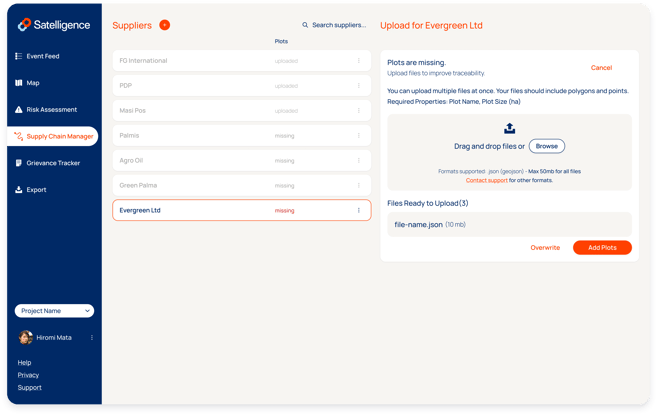
Polygons need to be provided in valid geojson format with .json or .geojson extension and represent a FeatureCollection of Points, Polygons or MultiPolygons.
Point data can also be provided as .csv or .xlsx file. Only the first tab of the xlsx file is parsed for point data. The geocoordinates have to be provided as lat or latitude and lng or longitude.
File requirements
- Invalid geometries are accepted, proper functioning of the upload function and risk assessment are guaranteed up to 25 self intersections per polygon.
- The coordinate reference system of the file needs to be WGS84
- Duplicate geometries per supplier are not allowed
- The maximum number of features per file is 400,000
- The maximum number of files per upload is 100
- The maximum file size is 1 GB
- The maximum size of combined files for an upload is 2 GB
Plot requirements
Polygons:
- When the plot is of type MultiPolygon each individual polygons smaller than one square meter (0.0001 ha) is automatically discarded
- Area must be between 1 square meter and 100,000 ha
- Maximum 2000 vertices per polygon are supported
Points:
- A default area of 4 ha is used if the area property is not specified.
Plot properties
A number of optional properties are supported and can be added to plots. The information allows for easier integration with the Traces information system and allows you to search for your plots with internal reference IDs or names. All other properties are preserved in the exports with no interference from the platform.
- ProducerName
- Description: the producer name for the corresponding plot, typically this is a farmer id or cooperative or other type of first level aggregator. One ProducerName can link to multiple plots
- Supported uploaded field names:
- ProducerName
- farmer_id
- Example: Producer_01
- ProducerCountry
- Description: The country of production enforcing the ISO2 country codes
- Supported uploaded field names:
- ProducerCountry
- Example: ID
- ProductionPlace
- Description: A name or ID for the plot provided by the user
- Supported uploaded field names:
- ProductionPlace
- name
- farm_id
- Example: S11_123456
- Area
- Description: plot size in ha used to explode points in circular polygons of the equivalent size. When omitted the point is rendered and assessed as a 4ha plot.
- Supported uploaded field names:
- Area
- sizeInHa
- Example: 2.17
Additional palm oil specific properties
- UmlIds
- Description: A comma separated string of UmlIds to link plots to mills in your supply chain
- Supported uploaded field names:
- UmlIds
- umlIds
- UML_IDS
- Example: PO1000004383, PO1000004384, PO1000004385
🛀 Read Data Collection and Data Cleaning for more guidance on how to prepare your data for upload.
File upload
Selecting files
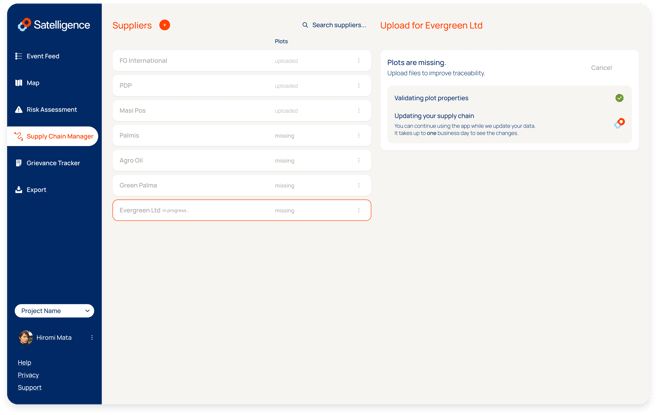
Select files from your file browser and drag those into the drop zone or click Browse to open a file picker. You can add multiple files (with the extension .json or .geojson) and the files can contain a mix of different geometry types. When you have all the files lined up, proceed by clicking Add Plots. You will first see a message Validating plot properties, followed by Updating your supply chain. You can leave this page and await updates to the platform. It takes up to one business day to see the changes.
Optional settings during upload
Additional requirements for TRACES
The EU Information System poses additional requirements on plots geometries that the platform fixes automatically before submitting, but you can also validate plots to meet those requirements before adding them to the plots of the supplier.
☝️ Tick the option to validate for TRACES submission when you want to share with the supplier any issues with plot acceptance by TRACES. Otherwise proceed without ticking the box. The platform will indicate plots that do not meet TRACES requirements in the risk assessment tool and apply fixes to those plots automatically when adding the plots to a DD Statement for submitting to TRACES.
Polygons:
- No holes (also known as donut geometries)
- No self intersections (where a vertex crosses another vertex)
Points:
- Area needs to be smaller than 4ha
Using a custom name property
You can specify the data column from your data that contains the names as used in your internal system. This means you don't need to explicitly rename the files' properties to "ProductionPlace" before uploading anymore. The app will look at the column name that was specified and use that to fill in the plot name in the app.
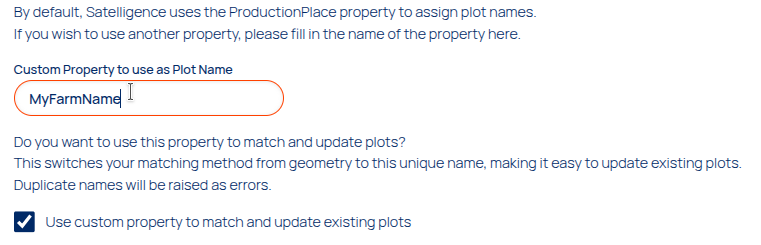
Plot matching on name instead of geometry
Whenever new plots are uploaded, the system checks existing plots to see if there are duplicates based on geometry. This is the default and it means that you don't need to keep track of the plot names in detail. However, this also means that if a specific farm gets remapped or a geometry slightly changes from one season to another, this is considered a new plot.
From now on users can choose to switch the plot matching method from geometry to plot name instead. This means our system will compare the new plot names with the old ones. This means the platform will consider the plot name (+supplier) as the identifier. This is great when using an internal naming system where farm geometries evolve over time. The limitation here is that this also means that duplicate names are not allowed anymore: having two plots with the same name leads to an error upon upload that will need to be fixed first ✅
Upload errors
More information on errors and solutions can be found here: Error handling (Error handling)
If you run into any errors, an error file is available for download in the user interface. The file contains specific information on the error that occurred on a per feature basis. Use this file to fix your errors before trying to submit the file again.
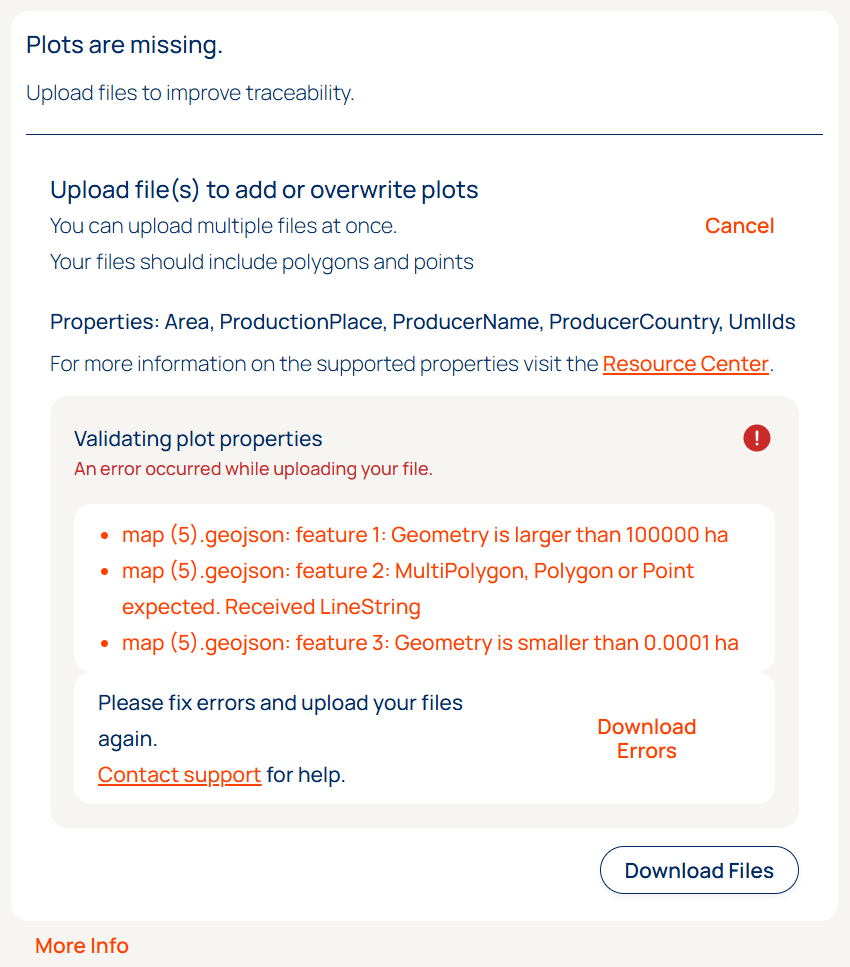
When dealing with errors, it is possible to validate your file using an online geojson validator. We like geojson.io but there is also an official validator from the European Commission. If this does work, you can contact support@satelligence.com for help preferably including the plots you are trying to upload.
You can choose to upload non-erroneous plots. To keep track of what you are ingesting and what plots are ignored, make sure to download the Error File before clicking Proceed with Errors.
Examples of when it makes sense to proceed with errors:
- You adding a set of plots that contain plots that have been added to the supplier in an earlier upload. You will see the error message
A supplier cannot have multiple plots with the same geometry, click proceed with errors to add the plots that were not in the earlier set. You will not see duplicate plots for the same supplier in the system. - You see the error
Geometry is smaller than 0.0001 hafor some plots in your file. This may happen when the producer of the file mistakingly cut plots into small pieces. In this case, proceeding with errors likely enables you to assess the majority of plots and almost the entire area of the combined plots. We advice to download the error file before proceeding and contacting the sender of the file to confirm that these plots can be ignored.
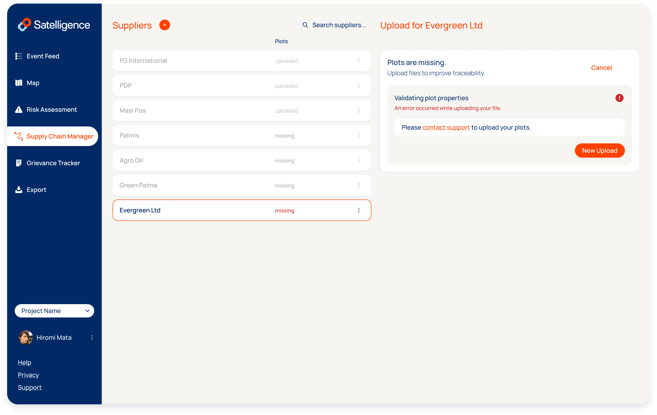
Successful Upload
If the plot upload went well you will see the supplier on the Risk Assessment page. Navigate to the Risk Assessment page using the left menu and click on the supplier you just created. You will see one or more plots corresponding to the plots you just uploaded.
🪄 Automatic update flow
- The supplier will be added to the Risk Assessment page immediately when created in the Supply Chain Manager
- The number of plots in the uploaded file will be listed immediately when clicking on the supplier on the Risk Assessment page
- The number of assessed plots will be listed in the top left above the plots when clicking on the plots. This number will be 0 at first, but it will match the number of plots in the uploaded file within 24 hours. Once assessed the plots will be categorized into the Deforestation Free categories and assigned the Negligible risk categorization and Risk Factors
- The map usually takes longer than the Risk Assessment and will show up within 24 hours.
Add more plots
If you have more plots for the same supplier you can add these to the plots already in the system.
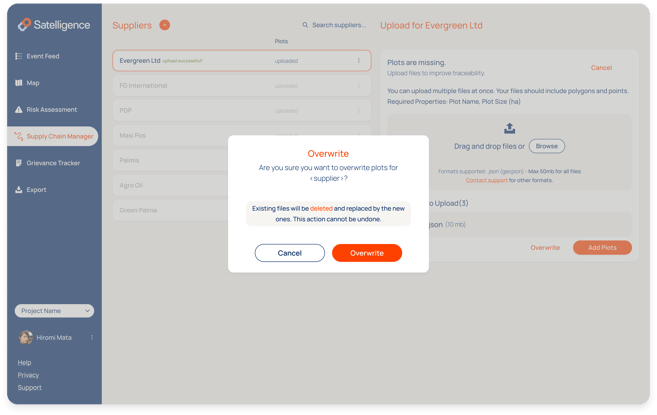
Replace plots
If you want to replace the plots, go through the same steps of adding the plot files, but click Overwrite instead.
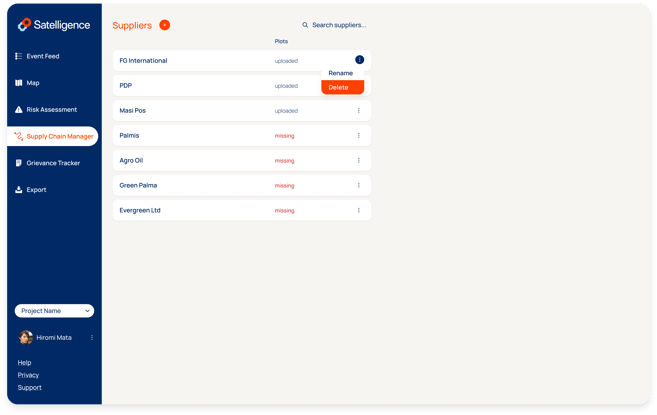
Delete plots
To start from scratch, click on the three vertical dots to the right of the supplier line and click remove to delete the supplier and all its associated data. Recreate the supplier to start with a clean slate.
It is also possible to request geolocation data or documentation directly from suppliers to allow them to upload to your project. For more information on this: Supplier forms (Supplier forms)