
The list page will show you a complete overview of all the plots in your supply chain. This overview will show you the total sum of the related deforestation (if any), the plots status and the cases status for each individual plot. The list can be sorted by any of these columns by clicking the column headers.
Direct land use change emissions
if you're subscribed to our Land use change (LUC) emissions service, the list page will display direct LUC emissions based on 20 year linear discounted emissions with the current value and a so called sparkline to show the emissions trend over the last 20 years.
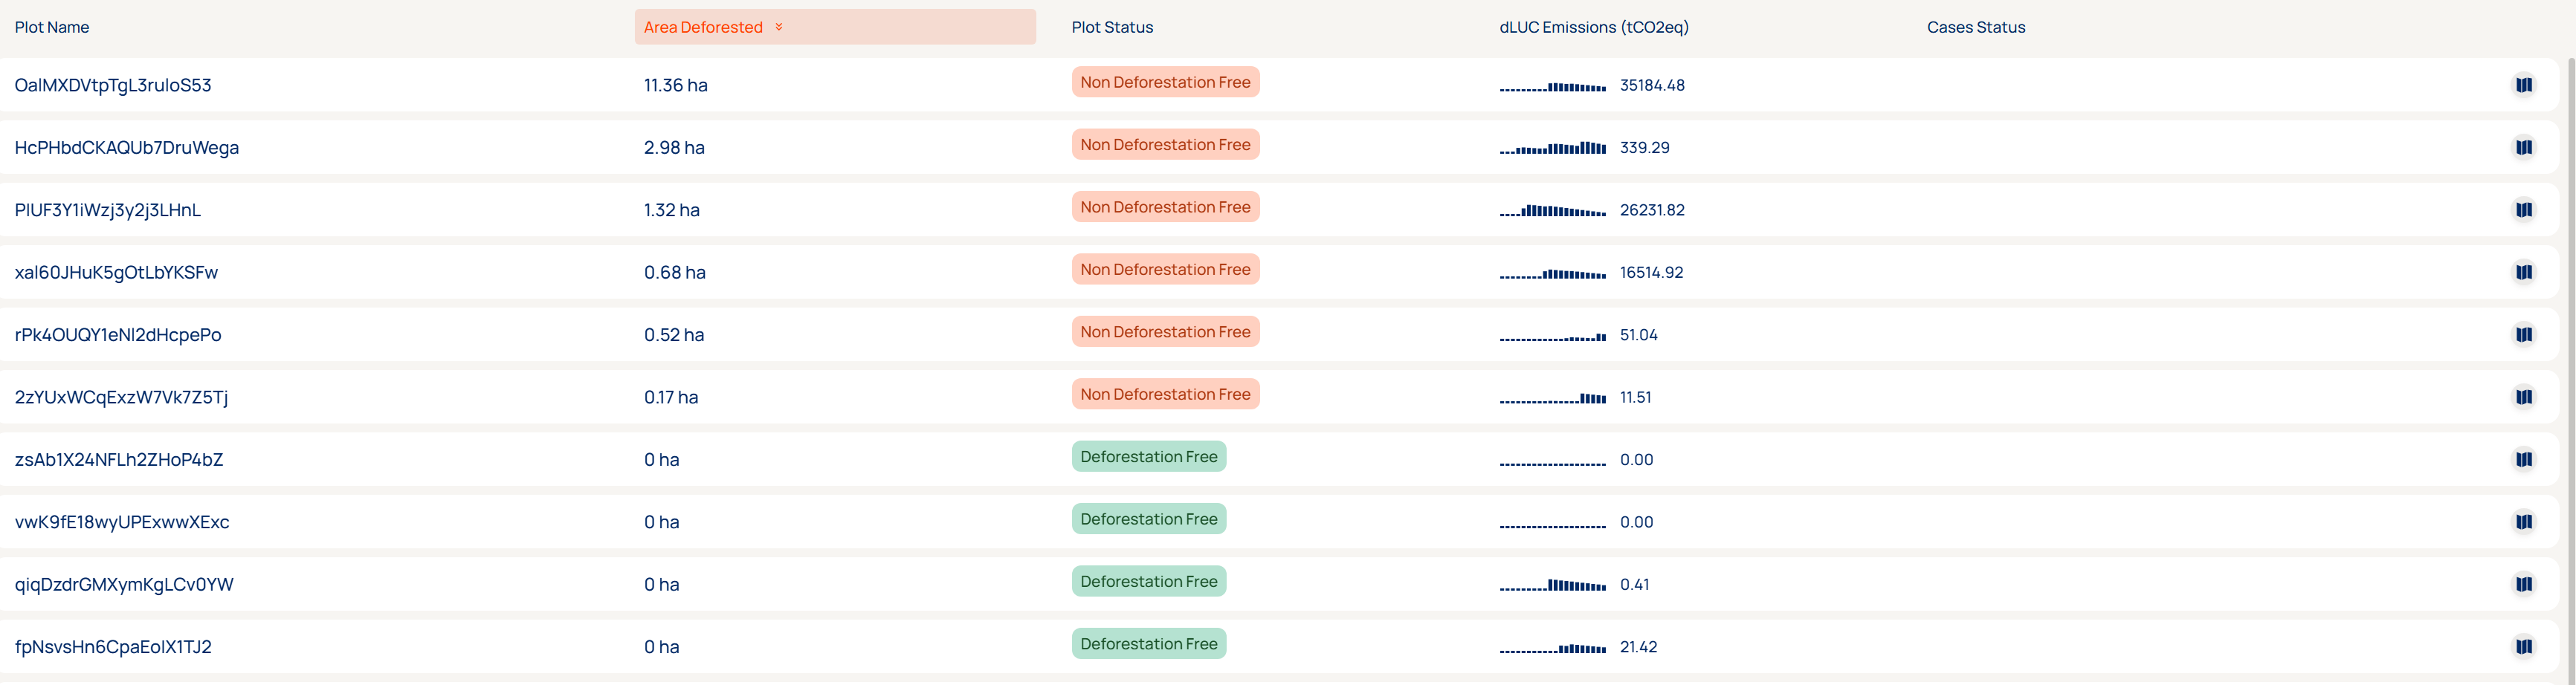
Note that the 20 year history applied to LUC emissions differs from the deforestation cutoff date that is applied. As a result plots can be deforestation free but still have non-zero LUC emissions.
Filtering
Alternatively, the list can be filtered to a supplier, company or group name by leveraging the fields in the top. More filters will be added soon to make more fine-grained subsetting of your supply chain possible!
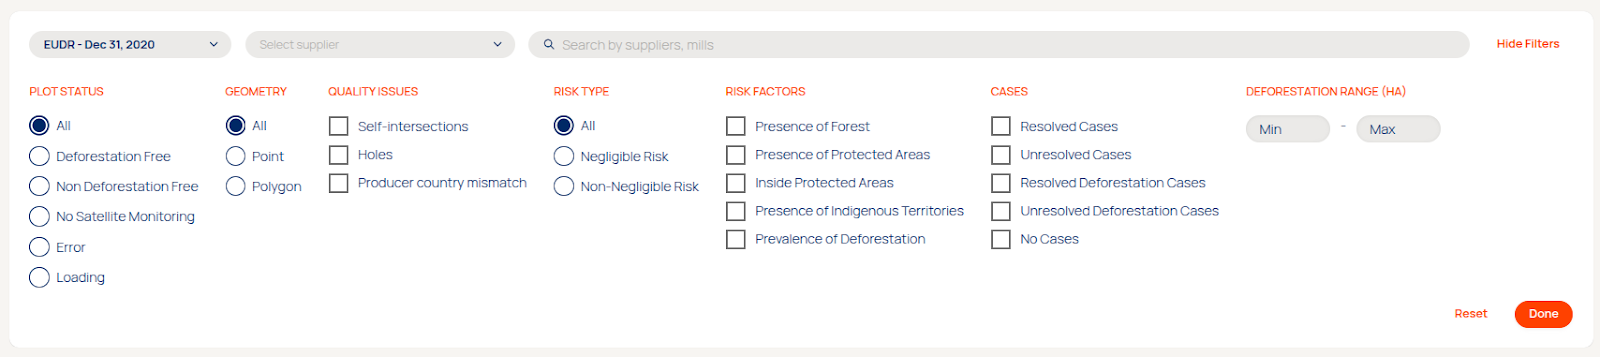
Applying filters will also prompt our hover menu in the bottom of the page that will let you apply actions in bulk or use the selected plots to create new cases, a new DDS or a new Season.

Details page
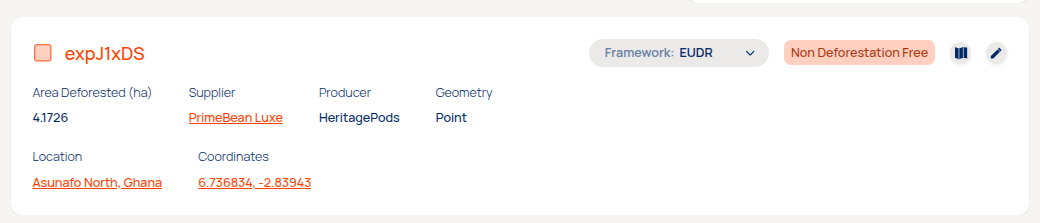
Selecting a row in the list page will direct you to a details page of all information available for that plot. A summary of the plot level risk assessment results is provided, as well as any supporting relevant details on the plot, what producer group and/or supplier it belongs and what jurisdiction and location the plot is in. If any plot quality issues were flagged by our platform, it will show in the Quality Issues section. A downloads section in the top of the page will allow you to download any relevant deforestation information in a GIS or spreadsheet format. The edit button next to the map icon will allow you to change the name or producer information of this single plot.
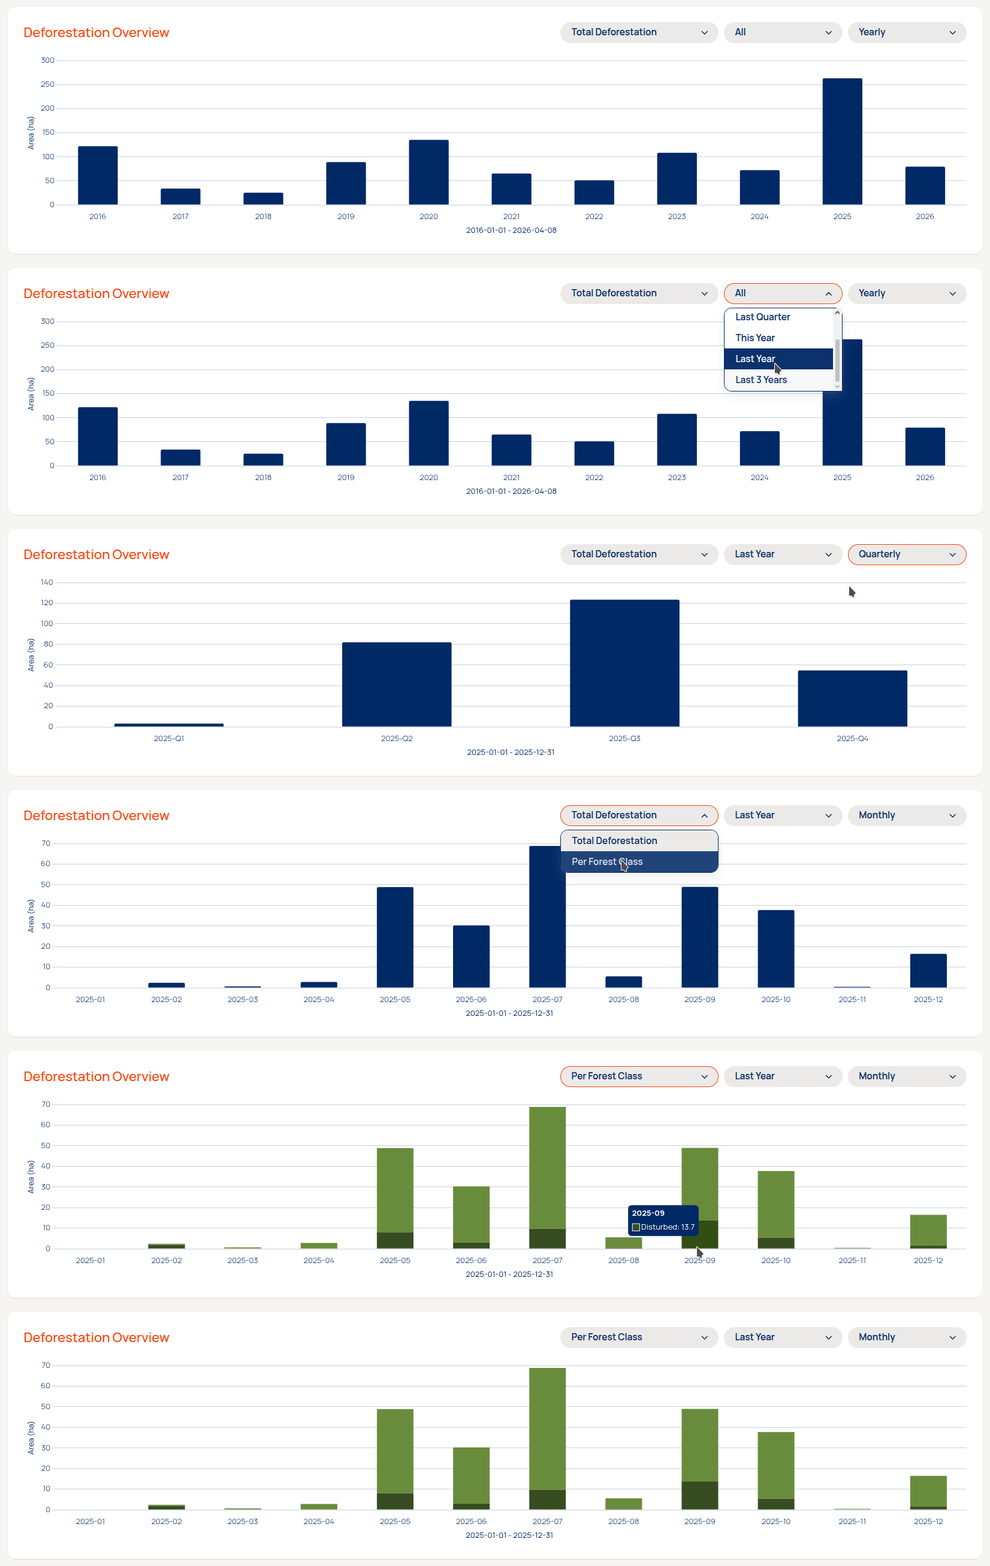
For each plot where forest loss was detected in our historical archive we'll display a timeline overview for the deforestation within the plot boundaries. The framework selected in the top section of the details page will determine the cutoff date for the graph, but you can now also choose to visualize a shorter timeframe from a period selector. Additionally, you can choose to aggregate the deforestation data to an annual, quarterly or monthly interval or alter the view to show the deforestation per lost forest type.
Emissions breakdown
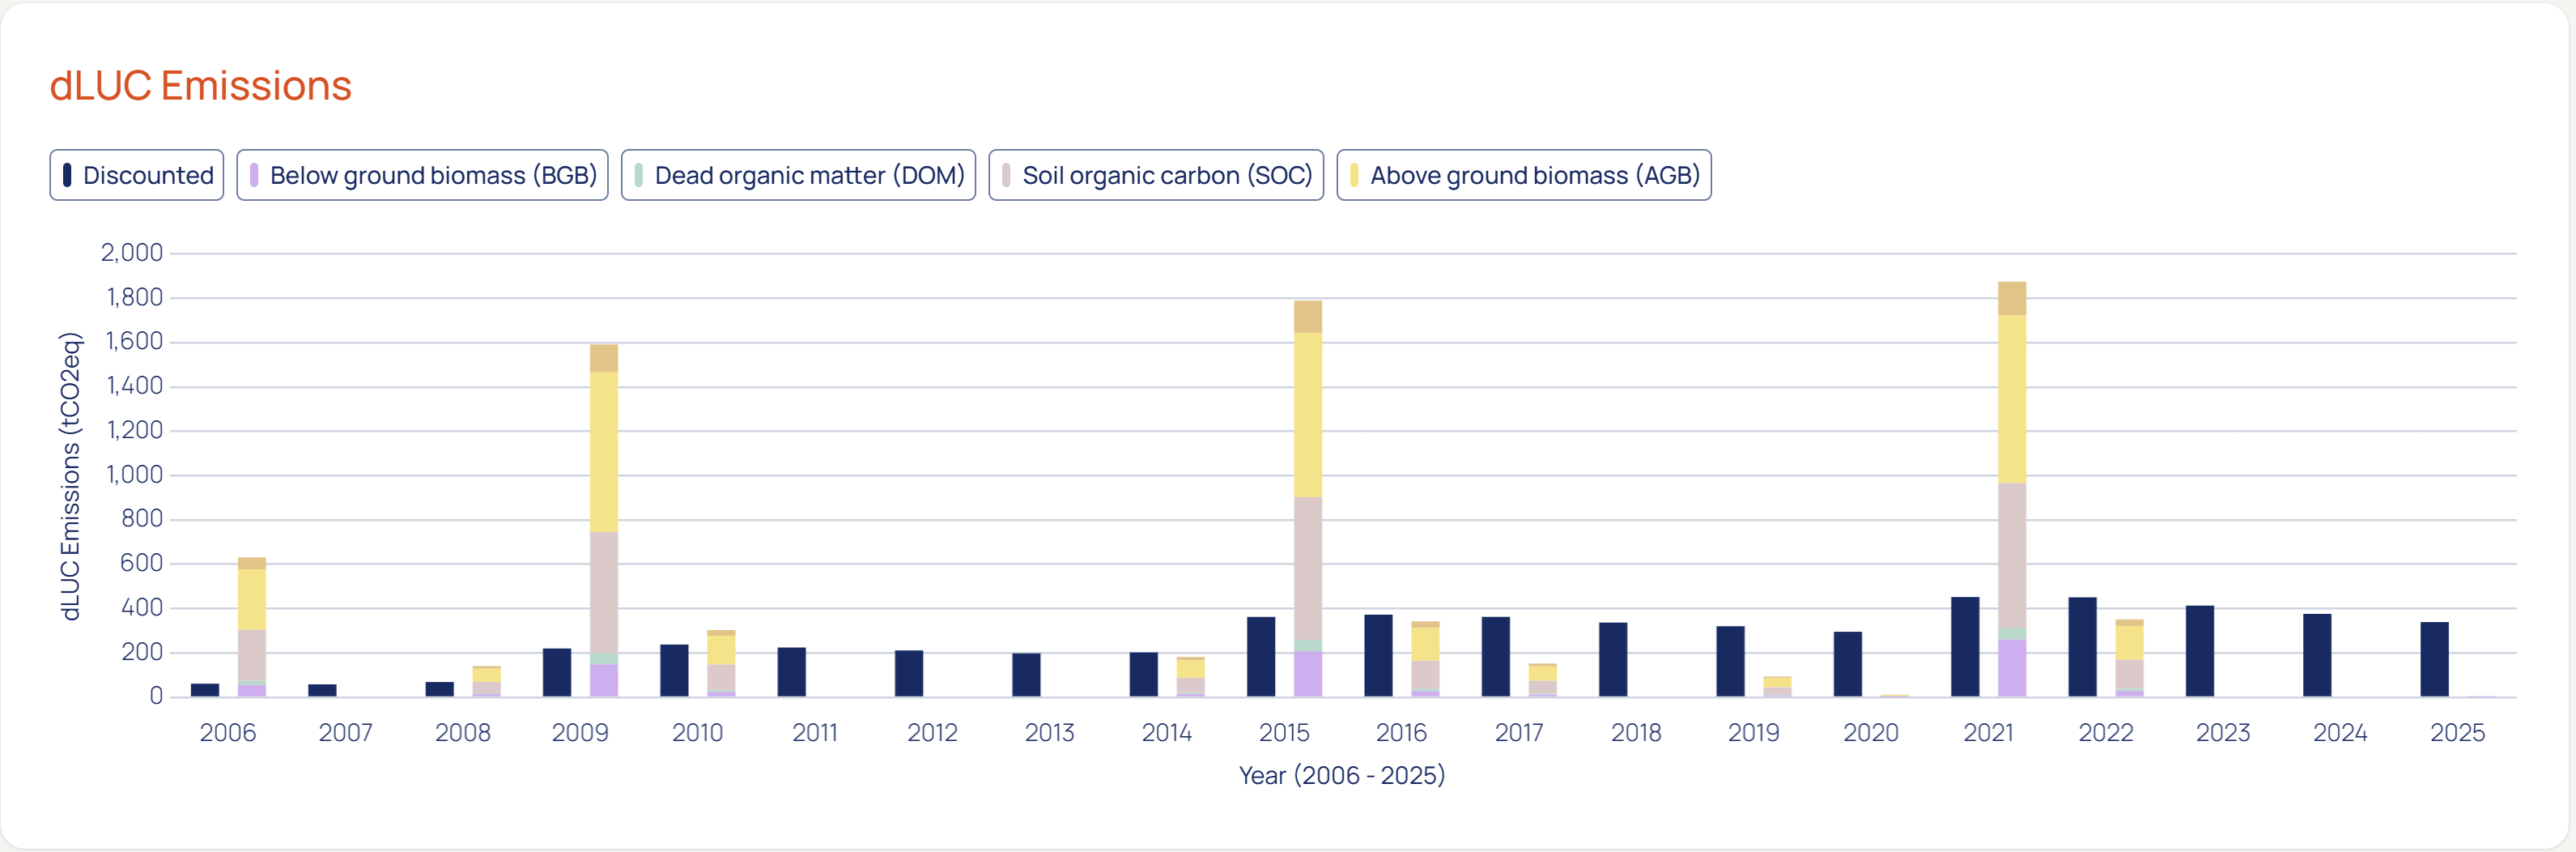
A breakdown of 20 year linear discounted emissions and raw emissions per carbon pool are shown over time in the bar chart. The underlying data is available for download on the export page.
Plots status
Non-Deforestation Free
A plot is considered Non Deforestation Free (Non DF) when there is deforestation inside plots. In this category, plots are sorted by descending deforestation inside plots since the cutoff date. Find Non DF plots with low amounts of deforestation by inverting the list.
Deforestation Free
A plot is considered Deforestation Free (DF) when there is no deforestation inside plots. Other risk factors can be present within the landscape of the plot.
No Satellite Monitoring
A plot is not covered by satellite monitoring, meaning deforestation is not being monitored and the risk cannot be accessed. Contact support@satelligence.com or your customer success manager to expand your monitoring region.
Loading
A plot is loading when the assessment is not finished yet. This state is always temporarily.
Error
The failed state is very uncommon. Plots end up in this state when it was not possible to execute our risk assessment on the plot. When this happens our support team can look into the underlying reason.
Risk factors
Four risk factors are considered:
- Presence of forest: whether the plot contains forest or there is forest within 500m of the plot boundary
- Presence of protected areas: whether the plot is inside a protected area or there are protected areas located within 500m of the plot boundary
- Presence of indigenous territories: whether the plot is located inside community land or in an area designated as indigenous territory or those areas are within 500m of the plot boundary
- Prevalence of deforestation: whether there is detected deforestation since EUDR cutoff date within 500m of the plot boundary
If any or all risk factors are present, then the plot is labeled as non-negligible risk and therefore requires risk mitigation to be compliant with the EUDR. If no factors are present then the plot is considered to have negligible risk. DF plots can also be linked to grievances that you can view and investigate by clicking on a single plot.
Quality Issues
Plots are assessed on quality issues. Plots with issues are displayed with a small exclamation mark in front of the green or red square.
Currently 3 quality issues are considered but expect others to be added later
|
Issue |
Definition |
Are auto fixed when submitting to TRACES |
|
Self intersections |
The lines of the geometry of the intersect with each other. We consider the area between the intersections, but when the shape is a large bowtie or hourglass, significant areas might be excluded in the assessment. These are best checked visually on the map. On the map the self intersection might not be visible since they can be smaller than the resolution of the map. If so the self intersection can be safely disregarded. |
Yes. When adding these plots to a DD statement the platform cuts the geometry with the self intersection into two separate polygons (part of the same plot) that cover the same extent. |
|
Holes |
The polygons of a plot contain one or more holes |
Yes. When adding these plots to a DD statement the platform cuts the geometry with the hole into two separate polygons (part of the same plot) that cover the same extent. |
Plot tags
The following plot tags are used:
|
Tag |
Definition |
|
Inside protected area |
Indication that (part of) a plot overlaps with a protected area. |
|
Unresolved |
Indication that the plot is linked to an unresolved (grievance) case. |
|
Resolved |
Indication that the plot is linked to a resolved (grievance) case. |